We can produce all our future electricity needs from renewable sources with the technologies we already have, and at a cost that will more than pay for itself with cheaper electricity prices over the long-term.
See Mark Z. Jacobson, No Miracles Needed, Cambridge University Press, 2023.
Potential for Renewable Sources vs Existing Capacity:
| Estimated Global potential (GW) | Global installed (GW)[1] | |
| Wind | 72,000[2] | 832 |
| Solar | 70,000[3] | 892 |
| Hydroelectric | 6,000[4] | 1,358 |
| Geothermal | 256[5] | 16 |
| Other | 150 | – |

Electricity: Wind
The technical potential[1] for generating electricity from wind resources in the US alone is estimated to be more than 12,000 GW from onshore wind[2] and another 2,800 GW from offshore.[3] This is more than ten times the total amount of electricity currently available in the US from all sources (1,200 GW) and almost double the total electricity generating capacity of the entire world in 2021.[4]
The Obama administration produced a detailed study in 2008, updated in 2015, which looked at the prospects for wind power in the United States.[5] The report concluded that wind power could provide 10% of the nation’s electricity by 2020, 20% by 2030 and at least 35% by 2050. That report was based purely on existing market trends and not on any assumption that the federal government might step in to help speed up the process.
When the report first came out in 2008, wind was providing just 1.5% of the US’s electricity. As of 2022, it was already providing about 10.2% of the nation’s electricity.[7]
Meanwhile, the cheapest wind power (using the levelized cost of electricity, or LCOE; see Chapter 4) has fallen below $30/MWh—better than the report’s estimate of what that figure might reach by 2030. With gas currently priced at $41-$74/MWh (LCOE), the economics of electricity generation have now shifted decidedly in favor of wind, even without government intervention.
Utility-scale wind farms
There are estimated to be 5.8 billion hectares of suitable onshore area for wind farm development across the globe and another 1.5 billion hectares of suitable offshore sites.[8] So the potential for powering the world with wind alone is enormous. The onshore figure includes forested areas, but these account for only about 6% of the total,[9] so even without cutting down any trees, wind remains the largest potential source of renewable electricity.
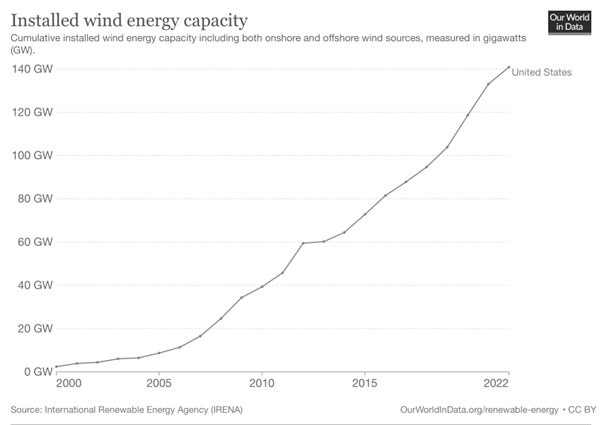
Currently, there are around 842 GW of onshore grid-connected wind power capacity,[10] including nearly 175 GW in the US (nearly double the total generating capacity of all nuclear power plants currently operating in the US), with over 1,500 wind farms operating across 44 states.[11]
Off-shore wind
Wind blowing over the ocean is generally much stronger and more consistent than wind blowing inland. More than 18 GW of wind is installed off the shores of UK, Denmark and Germany. In total, there is around 64.3 GW of installed offshore wind capacity throughout the globe.[12]
Currently, the US has only two operating offshore wind farms, one producing 30 MW (0.03 GW) off the coast of Rhode Island and another producing 12 MW (0.012 GW) off the coast of Virginia.[13] But there are already more than 40 GW of offshore wind projects under construction across 15 states.[14]
The upfront costs of installing offshore wind are considerably higher than for onshore wind farms, so more financial support is needed to take full advantage of it. However, the reliability and efficiency of the turbines, once installed, can more than offset these costs over the longer term.
Distributed wind
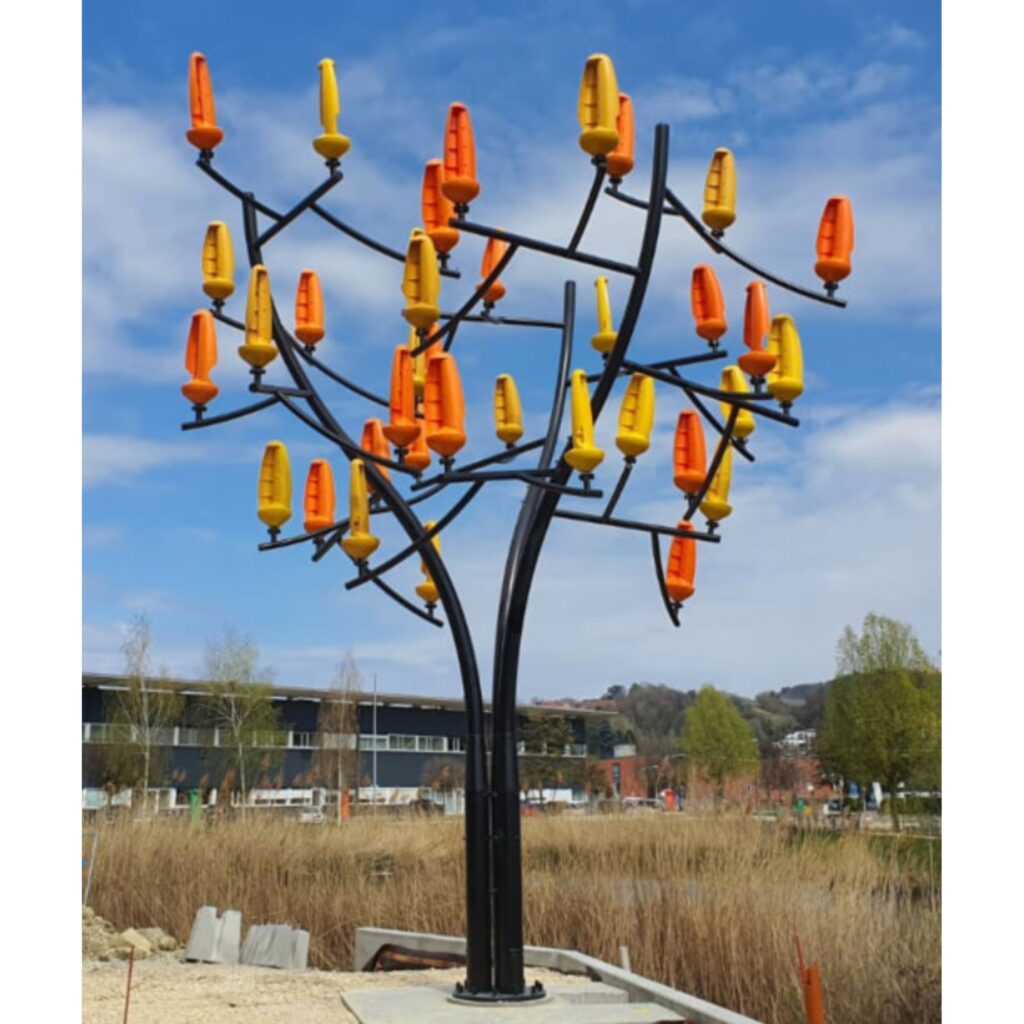
Smaller-scale (“distributed”) wind turbines installed on homes, farms, schools, factories, commercial premises and government buildings, are another potential source of electricity, especially for rural communities.
The Distributed Wind Energy Association (DWEA) estimates that there are 23 million suitable locations for distributed wind in the US, with the potential for 1,100 GW of generating capacity, or roughly the current total electricity generating capacity of the US from all sources.[15]
The DWEA launched a strategy in 2014 to achieve 30 GW of distributed wind by 2030. Installed distributed wind capacity in the US as of 2022 stood at just over 1 GW of electricity from over 89,000 turbines in all 50 states.[17] Globally as of 2022 there were around 1.9 GW of installed small wind capacity.[18]
Turbine sourcing and recycling
Wind turbines produce carbon-free energy, but at present they are not carbon-free to manufacture nor to dispose of. It takes a considerable amount of steel and cement to make a windmill, and those are currently very fossil fuel dependent materials. Other rare earth metals are needed for the turbines.
There are efforts underway to decrease the net carbon impact of standard cement (called Portland cement) through methods such as combining it with industrial waste or incorporating CO2 into the cement material itself.[19] There are also a number of projects attempting to develop natural fiber-reinforced composite materials using “spruce, bamboo, jute, birch, sisal, and Douglas fir.”[20] Fossil-free steel production is already well advanced in a number of countries (see chapter 6).
Balsa wood is also used in some turbine blades, and unfortunately the demand for balsa has played a role in the deforestation of the Amazon rainforest.[21] Ecuador went from exporting 19,226 tons of balsa wood in 2018 to 74,680 tons of balsa wood in 2020. Further, from March 2020 to June 2021 most of the 8,139 deforestation alerts in the Ecuadorian Amazon rainforest occurred in the Pastaza River basin, one of the major areas where balsa is extracted.[22]
If our goal is to build a completely green wind turbine, we need to stop using balsa and work on extending the lifetime of the blades, which currently last about 20-25 years. Extending blade life by just five years could reduce the negative environmental impact of wind turbines by 24%.[23]
Approximately 80-85% of the mass of a wind turbine can be recycled without complication (this includes the cement) – and research right now is primarily focused on increasing the efficiency of recycling wind turbine blades. Currently, one of the most common recycling methods involves grinding the blades into a fine material, sieving out fibrous materials, and then using these fibers to reinforce asphalt and cement.[24]
Environmental impact
Large-scale onshore wind farms are increasingly built on tree-covered mountaintops and involve equally large-scale clear-cutting of forests. The news that 13.9 million trees were cut down in Scotland to make way for wind farms caused quite a stir in 2020.[25] Wind is the world’s cleanest and most promising source of electricity, but cutting down trees in the process makes no sense at all from a climate perspective (see Chapter 6).
Another area of concern with wind power is its effect on wildlife. Estimates vary, but between three studies in 2013 and 2014, the number of birds killed annually in the United States due to wind power was estimated at around 360,000.[26] Estimates for bats in 2013 came between 600,000 and 888,000 – since wind energy capacity has approximately doubled since that time, it is very likely that annual deaths have increased as well.[27]
A number of methods have been used or proposed to attempt to decrease these deaths, such as painting turbine blades black, adding lights to increase visibility, and stopping use during busy migration seasons.[28] One experiment found that painting one of three wind turbine blades black reduced bird fatalities by over 70%.[29]
While the impact of wind turbines on birds requires action and further research, it should not be presented as one of the largest threats to avian life in the United States. For comparison, a 2013 study estimated that between 1.3 to 4 billion birds are killed each year in the United States alone by free-ranging domestic cats. That represents a threat to birds that is over 1,000 times greater than wind turbines.[30]
[1] Theoretical potential is the average annual energy available from a source of energy; the technical potential is the portion of the theoretical resource that can be captured with a specified technology; and the practical potential is the portion of the technical resource available after consideration of social, economic, regulatory, and environmental constraints. See:
National Research Council. (2013). Summary. In An Evaluation of the U.S. Department of Energy’s Marine and Hydrokinetic Resource Assessments. The National Academies Press. https://doi.org/10.17226/18278.
[2] NREL, “NREL Study Finds U.S. Wind Energy Potential Triples Previous Estimates,” in NREL Highlights, Feb 2011. https://www.nrel.gov/docs/fy11osti/50860.pdf
[3] Laurie, Carol (2023), “What Will It Take to Unlock U.S. Floating Offshore Wind Energy?” NREL News: https://www.nrel.gov/news/program/2023/what-will-it-take-to-unlock-us-floating-offshore-wind-energy.html
[4] See Table 5.6 above.
[5] U.S. Department of Energy. (2015). A New Era for Wind Power in the United States. https://www.energy.gov/sites/prod/files/WindVision_Report_final.pdf
[6] IRENA. (2023). IRENASTAT Online Data Query Tool. International Renewable Energy Agency. https://pxweb.irena.org/pxweb/en/IRENASTAT/IRENASTAT__Power%20Capacity%20and%20Generation/RECAP_2023_cycle2.px/table/tableViewLayout1/
https://creativecommons.org/licenses/by/4.0/
[7] Center for Sustainable Systems. (2022). U.S. Renewable Energy Factsheet. University of Michigan. https://css.umich.edu/publications/factsheets/energy/wind-energy-factsheet
[8] Dupont, E., Koppelaar, R., & Jeanmart, H. (2018). Global available wind energy with physical and energy return on investment constraints. Applied Energy, 209, 325. https://www.researchgate.net/publication/320686586_Global_available_wind_energy_with_physical_and_energy_return_on_investment_constraints
[9] Ibid, p.50.
[10] Hutchinson, M., & Zhao, F., et al. (2023). Global Wind Report 2023. In GWEC (p. 102). https://gwec.net/wp-content/uploads/2023/04/GWEC-2023_interactive.pdf
[11] Brock, S. (2020, February 27). AWEA: Wind Energy Now Top Source of Renewable Electricity. ACP; American Clean Power. https://cleanpower.org/news/awea-wind-energy-now-top-source-of-renewable-electricity/
[12] Hutchinson, M., & Zhao, F., et al. (2023). Global Wind Report 2023. In GWEC (p. 102). https://gwec.net/wp-content/uploads/2023/04/GWEC-2023_interactive.pdf
[13] Brown, M. T. (2022, June 30). Developers plan to add 6 gigawatts of U.S. offshore wind capacity through 2029. EIA. https://www.eia.gov/todayinenergy/detail.php?id=52940
[14] Musial, W., et al. (2022). Offshore Wind Market Report: 2022 Edition. In U.S. Department of Energy. https://www.energy.gov/sites/default/files/2022-09/offshore-wind-market-report-2022-v2.pdf
[15] DWEA. (2015). DWEA Distributed Wind Vision – 2015-2030. https://distributedwind.org/wp-content/uploads/2012/08/DWEA-Distributed-Wind-Vision.pdf
[16] This WindTree micro-turbine from New World Wind is rated at 10.8 kW, similar to the output of an entire roof of solar panels. It is designed to work in light breeze, does not make noise or hurt birds. See https://www.newworldwind.com/windtree
[17] Wind Energy Technologies Office. (2022, August 16). Distributed Wind Market Report: 2022 Edition. U.S. Department of Energy. https://www.energy.gov/eere/wind/articles/distributed-wind-market-report-2022-edition
[18] Orrell, A., et al. (2023). Distributed Wind Market Report: 2023 Edition. In U.S. Department of Energy (p. 13). https://www.energy.gov/sites/default/files/2023-08/distributed-wind-market-report-2023-edition_0.pdf
[19] P. Badjatya, et al. (2022). Carbon-negative cement manufacturing from seawater-derived magnesium feedstocks. Proceedings of the National Academy of Sciences, 119, 1. https://doi.org/10.1073/pnas.2114680119
[20] Khalid, M. Y., Arif, Z. U., Hossain, M., & Umer, R. (2023). Recycling of wind turbine blades through modern recycling technologies: A road to zero waste. Renewable Energy Focus, 44, 384. https://doi.org/10.1016/j.ref.2023.02.001
[21] Ferro, C. (2021, December 27). Wind turbine propellers boost balsawood sales. Global Affairs and Strategic Studies; Universidad de Navarra. https://en.unav.edu/web/global-affairs/las-helices-de-los-aerogeneradores-disparan-las-ventas-de-madera-de-balsa
[22] Baquero, D. C. (2021, July 12). Alerta roja: la fiebre de la madera balsa en Ecuador ya es detectada por los satélites. Mongabay. https://es.mongabay.com/2021/07/madera-balsa-ecuador-deforestacion-amazonia/
[23] Cooperman, A., Eberle, A., & Lantz, E. (2021). Wind turbine blade material in the United States: Quantities, costs, and end-of-life options. Resources, Conservation and Recycling, 168, 105439. https://doi.org/10.1016/j.resconrec.2021.105439
[24] Khalid, M. Y., Arif, Z. U., Hossain, M., & Umer, R. (2023). Recycling of wind turbine blades through modern recycling technologies: A road to zero waste. Renewable Energy Focus, 44, 377. https://doi.org/10.1016/j.ref.2023.02.001
[25] See Bol, D. (2020, March 25). 14 million trees axed to make way for wind farms. Energy Central. https://energycentral.com/news/14-million-trees-axed-make-way-wind-farms
[26] Johnson, D. (2016). Avian Fatalities at Wind Energy Facilities in North America: a Comparison of Recent Approaches. Human–Wildlife Interactions, 10(1), 15. https://doi.org/10.26077/a4ec-ed37
[27] Smallwood, K. S., & Bell, D. A. (2020). Effects of Wind Turbine Curtailment on Bird and Bat Fatalities. The Journal of Wildlife Management, 84(4), 685. https://doi.org/10.1002/jwmg.21844
[28] Smallwood, K. S., & Bell, D. A. (2020). Effects of Wind Turbine Curtailment on Bird and Bat Fatalities. The Journal of Wildlife Management, 84(4), 694-695. https://doi.org/10.1002/jwmg.21844
[29] May, R., et al. (2020). Paint it black: Efficacy of increased wind turbine rotor blade visibility to reduce avian fatalities. Ecology and Evolution, 10(16), 8927. https://doi.org/10.1002/ece3.6592
[30] Loss, S. R., Will, T., & Marra, P. P. (2013). The impact of free-ranging domestic cats on wildlife of the United States. Nature Communications, 4(1), 1. https://doi.org/10.1038/ncomms2380
Electricity: Solar
Solar power comes in two main forms: photo-voltaic (PV) solar panels that convert sunlight directly into electricity, and various forms of solar thermal (CSP) power that concentrate the heat of the sun to boil water and run turbines similar to any other electricity generating plant. The technical potential for solar powered electricity is even greater than for wind, with an estimated 613,000 TWh/yr global generating capacity available,[1] or roughly 20 times the total amount of electricity produced worldwide in 2022.
Utility-scale solar PV farms
Currently, there is approximately 1,061 GW of solar capacity installed worldwide,[3] including 137 GW of PV solar capacity in the US, providing nearly 5% of the nation’s electricity.[4]
Costs per kWh have fallen even faster for solar PV than they have for wind. This makes utility-scale solar PV farms much more attractive as an option, especially in parts of the world where sun and vast open spaces are both plentiful.
Concentrated solar power (CSP) plants
As of 2021, there were 50 CSP projects worldwide, with 6.8 GW of electricity generating capacity, mostly in Spain. These involve a field of mirrors pointing the rays of the sun to a central tower where water is boiled to run turbines. So far, only eight of these are in the US, mostly in California. Total CSP capacity of these plants as of 2021 was 1.8 GW.[5]
Although PV technologies are now considerably cheaper, CSP has the advantage of being able to store energy (using molten salt) without the use of batteries, and to step up production to meet peak demand. For these reasons, many consider CSP an important part of the mix in future electricity production.
Distributed Solar (Rooftop)
As with distributed wind, rooftop solar is an option that can potentially provide large numbers of people not just with carbon-free electricity, but with virtually cost–free electricity, once installed. Unlike small-scale wind turbines, however, which are much less efficient than the giant ones, rooftop solar panels can be as efficient as those found on massive solar farms.
According to US government studies,[6] over 8 billion square meters of rooftops in the US could be producing over 1,000 GW (1 terrawatt) of electricity, roughly equal to the total amount of electricity currently being generated in the US.
Sourcing and recycling of PV panels
PV solar panels are made predominantly from quartz, which is the most abundant mineral on the planet. However, other toxic chemicals and materials are involved in the production, as well as large amounts of energy.
While there are a few different types of solar panels, the most common kind is a crystalline silicon panel made of around 76% glass, 10% polymer, 8% aluminum, 5% silicon, 1% copper and less than 0.1% of silver and other metals (such as tin and lead).[7]

A 2020 Nature Energy article projected that there would be 8 million tons of PV waste by 2030 and 80 million tons by 2050.[9] While concrete numbers are not available, anecdotal evidence suggests that less than 10% of solar panels that have reached the end of their useful life (roughly 30 years) are being recycled rather than sent to landfills.[10]
In June of 2023 the first factory in the world solely dedicated to recycling solar panels was opened in France.[11] While this is a significant step, solar panel waste is projected to grow rapidly. So recycling facilities need to be expanded quickly, especially as silver availability represents a bottleneck in solar panel production.[12]
Delamination, the process of splitting a PV cell into distinct parts which can then be recycled, is primarily done through chemical, mechanical, or thermal means.[13] One economically viable method is able to recover 90% of the PV panel’s mass while refraining from emitting dangerous gasses.[14] The real problem is pressuring industry to implement these proven, green methods on a mass scale.
Large-scale solar PV farms also take up a lot of open space that could be used for farming or recreation. Once again, it makes no sense at all to cut down forests in order to install solar farms (see chapter 6). “Agrivoltaics” is a novel approach that involves interspersing solar panels with crops and grazing animals.[15] Other obvious locations for putting solar panels, apart from rooftops, include alongside highways, on top of parking lots and landfills, in deserts, on brownfield sites, etc.
[1] Veronesi, F., et al. (2016). Estimation of the Global Solar Energy Potential and Photovoltaic Cost with the use of Open Data. DOAJ (DOAJ: Directory of Open Access Journals), 9, 1. https://www.researchgate.net/publication/292991459_Estimation_of_the_Global_Solar_Energy_Potential_and_Photovoltaic_Cost_with_the_use_of_Open_Data
[2] Arafa, M., & Said, E. (2019). A different vision for uninterruptible load using hybrid solar-grid energy. IJPEDS, 10(1), 382. https://doi.org/10.11591/ijpeds.v10.i1.pp381-387
CC BY-SA 4.0https://creativecommons.org/licenses/by-sa/4.0/
[3] IRENA. (2023). IRENASTAT Online Data Query Tool. International Renewable Energy Agency. https://pxweb.irena.org/pxweb/en/IRENASTAT/IRENASTAT__Power%20Capacity%20and%20Generation/RECAP_2023_cycle2.px/table/tableViewLayout1/
[4] SEIA. (2023, September 7). U.S. Solar Market Insight. Solar Energy Industries Association. https://www.seia.org/us-solar-market-insight
[5] Wikipedia contributors. (2019, December 3). List of solar thermal power stations. Wikipedia, the Free Encyclopedia; Wikimedia Foundation. https://en.wikipedia.org/wiki/List_of_solar_thermal_power_stations
[6] Department of Energy. (n.d.). Solar Rooftop Potential. Office of Energy Efficiency & Renewable Energy. https://www.energy.gov/eere/solar/solar-rooftop-potential
[7] Dominish, E., Teske, S., & Florin, N. (2019). Responsible minerals sourcing for renewable energy. Earthworks. https://earthworks.org/assets/uploads/2019/04/MCEC_UTS_Report_lowres-1.pdf
[8] Data from Dominish, E., Teske, S., & Florin, N. (2019). Responsible minerals sourcing for renewable energy. Earthworks. https://earthworks.org/assets/uploads/2019/04/MCEC_UTS_Report_lowres-1.pdf
[9] Heath, G. A., et al. (2020). Research and development priorities for silicon photovoltaic module recycling to support a circular economy. Nature Energy, 5(7), 502–510. https://doi.org/10.1038/s41560-020-0645-2
[10] Curtis, T., et al. (2021). Solar Photovoltaic Module Recycling: A Survey of U.S. Policies and Initiatives (p. 1). National Renewable Energy Laboratory. https://www.nrel.gov/docs/fy21osti/74124.pdf
[11] Gordon, D. (2023, June 3). Solar panels – an eco-disaster waiting to happen? BBC News. https://www.bbc.com/news/science-environment-65602519
[12] Gordon, D. (2023, June 3). Solar panels – an eco-disaster waiting to happen? BBC News. https://www.bbc.com/news/science-environment-65602519
[13] A 2022 paper focused on crystalline silicon panels describes a variety of proposed methods and discusses their success (separation rate) and comments on their drawbacks: Wang, X., et al. (2022). A review of end-of-life crystalline silicon solar photovoltaic panel recycling technology. Solar Energy Materials and Solar Cells, 248, 6. https://doi.org/10.1016/j.solmat.2022.111976
[14] Fiandra, V., Sannino, L., Andreozzi, C., Fabiana Corcelli, & Giorgio Graditi. (2019). Silicon photovoltaic modules at end-of-life: Removal of polymeric layers and separation of materials. Waste Management, 87, 97–107. https://doi.org/10.1016/j.wasman.2019.02.004
[15] Turrentine, J. (2022, February 23). Made in the Shade: The Promise of Farming with Solar Panels. NRDC. https://www.nrdc.org/stories/made-shade-promise-farming-solar-panels
Electricity: Hydro
Globally, as of 2022, hydropower represents approximately 1,390 GW of energy capacity.[1] China has the largest share of hydropower capacity in the world, approximately 368 GW of capacity in 2022, followed by Brazil with 110 GW. The United States’ capacity is at 84 GW, similar to Canada which has 83.5 GW of hydropower capacity.[2] In the US, hydroelectric power from existing dams currently provides about 6% of the nation’s electricity, with 84 GW of capacity from conventional dams, plus another 19 GW of pumped storage.[3],[4]
In addition to the 2,000 dams that currently produce hydroelectricity, there are approximately 80,000 “non-powered” dams across the US. A DOE report from 2011 suggested as much as 22 GW of additional electricity could be generated from just 100 of these existing dams, without the need to need to build any new dams or disrupt environments.[5]
Another study in 2014 by Oak Ridge National Laboratory identified a further 65.5 GW of potential hydroelectric power from areas that would cause the minimum environmental and recreational disruption.[6]

Run-of-the-river hydro
An alternative to dams is “run-of-the-river” systems which use the flow of water to turn a wheel, much like the old-fashioned water wheels used in the Middle Ages. The current can also be diverted to flow through a pipe and spin a turbine before returning to the same water system. One study found that along one river in central Ethiopia,[8] run-of-the-river projects could generate around 540 GWh per year.[9]
Run-of-the-river systems are generally considered to be more ecologically sound than traditional hydroelectricity, but impacts at present include altered flows, fish injuries, habitat degradation and water depletion.[10] These issues primarily occur due to lack of planning and poor management practices, particularly occurring in so-called “developing and transition countries.” If we take this technology seriously and encourage global collaboration it can be a proper, adaptive alternative to massive dams.[11]
Environmental impacts
Building dams and flooding large areas of land is hugely disruptive to local wildlife habitats and to indigenous communities that occupy that land or hold it sacred. As noted above, there are already thousands of dams that are not in use, at least in the United States. So there is absolutely no need nor any suggestion that the US should build more dams. There are still dams being constructed, however, in Brazil, Philippines, Croatia, Slovenia, Cambodia and Zambia.[12] These are not an appropriate response to the climate crisis.
Current standard methods for keeping fish away from the turbine structure largely fail, allowing 35-88% fish through hydroelectric turbines.[13] An average of 22% of these are killed in the process.[14] However, research is progressing to decrease and eliminate fish mortality due to hydroelectric turbines. Natel Energy, a United States company, conducted testing of their “Restoration Hydro Turbine” alongside the Pacific Northwest National Laboratory and found 100% survival in their testing with 60 trout and 47 American eels.[15] Large-scale industry implementation of these new methods or governmental regulation requiring wildlife safety in hydropower is necessary to develop hydropower into a sustainable option.
[1] IRENA. (2023). IRENASTAT Online Data Query Tool. International Renewable Energy Agency. https://pxweb.irena.org/pxweb/en/IRENASTAT/IRENASTAT__Power%20Capacity%20and%20Generation/RECAP_2023_cycle2.px/table/tableViewLayout1/
[2] IRENA. (2023). IRENASTAT Online Data Query Tool. International Renewable Energy Agency. https://pxweb.irena.org/pxweb/en/IRENASTAT/IRENASTAT__Power%20Capacity%20and%20Generation/RECAP_2023_cycle2.px/table/tableViewLayout1/
[3] EIA. (2020, March 30). Hydropower Explained. U.S. Energy Information Administration. https://www.eia.gov/energyexplained/hydropower/
[4] IRENA. (2023). IRENASTAT Online Data Query Tool. International Renewable Energy Agency. https://pxweb.irena.org/pxweb/en/IRENASTAT/IRENASTAT__Power%20Capacity%20and%20Generation/RECAP_2023_cycle2.px/table/tableViewLayout1/
[5] Hadjerioua, B., et al. (2012). An Assessment of Energy Potential at Non-Powered Dams in the United States. U.S. Department of Energy. https://www1.eere.energy.gov/water/pdfs/npd_report.pdf
[6] Factors taken into consideration for determining suitable sites for hydropower included location of listed fish species, habitat disturbance, protected lands, fishing and boat use, affect on water quality, etc. There may well be other environmental considerations not taken adequately into account.
Kao, S., et al. (2014). New Stream-Reach Development: A comprehensive assessment of hydropower energy potential in the United States. https://doi.org/10.2172/1130425
[7] Hoes, O. A. C., Meijer, L. J. J., van der Ent, R. J., & van de Giesen, N. C. (2017). Systematic high-resolution assessment of global hydropower potential. PLOS ONE, 12(2), 5. https://doi.org/10.1371/journal.pone.0171844
CC BY 4.0 https://creativecommons.org/licenses/by/4.0/
[8] The length of this river is 127km.
[9] Ibrahim, M., Imam, Y., & Ghanem, A. (2019). Optimal planning and design of run-of-river hydroelectric power projects. Renewable Energy, 141, 865, 869. https://doi.org/10.1016/j.renene.2019.04.009
[10] Kuriqi, A., et al. (2021). Ecological impacts of run-of-river hydropower plants—Current status and future prospects on the brink of energy transition. Renewable and Sustainable Energy Reviews, 142, 13. https://doi.org/10.1016/j.rser.2021.110833
[11] Kuriqi, A., et al. (2021). Ecological impacts of run-of-river hydropower plants—Current status and future prospects on the brink of energy transition. Renewable and Sustainable Energy Reviews, 142, 13. https://doi.org/10.1016/j.rser.2021.110833
[12] WWF. (2021). WWF study finds 509 new dams planned or under construction in protected areas. World Wildlife Fund. https://www.worldwildlife.org/magazine/issues/spring-2021/articles/wwf-study-finds-509-new-dams-planned-or-under-construction-in-protected-areas
[13] Knott, J., et al. (2023). Downstream fish passage at small-scale hydropower plants: Turbine or bypass? Frontiers in Environmental Science, 11, 1. https://doi.org/10.3389/fenvs.2023.1168473
[14] Radinger, J., van Treeck, R., & Wolter, C. (2022). Evident but context-dependent mortality of fish passing hydroelectric turbines. Conservation Biology, 36, 1. https://doi.org/10.1111/cobi.13870
[15] Water Power Technologies Office. (2022, March 9). Natel Restoration Hydro Turbines Increase Fish Passage Without Compromising Hydropower Generation. Office of Energy Efficiency & Renewable Energy; U.S. Department of Energy. https://www.energy.gov/eere/water/articles/natel-restoration-hydro-turbines-increase-fish-passage-without-compromising
Electricity: Geothermal
Currently, there is approximately 14.6 GW of geothermal energy capacity currently installed worldwide.[1] This includes 32 geothermal energy plants with a total capacity of 3.7 GW of electricity in the US (including one in Hawaii).[2] A number of new plants are under construction or planned in several states with geothermal potential. Total geothermal potential in the US is estimated at 9 GW out of around 256 GW worldwide.[3] So the contribution of geothermal to overall electricity demand is likely to remain small.
[1] IRENA. (2023). IRENASTAT Online Data Query Tool. International Renewable Energy Agency. https://pxweb.irena.org/pxweb/en/IRENASTAT/IRENASTAT__Power%20Capacity%20and%20Generation/RECAP_2023_cycle2.px/table/tableViewLayout1/
[2] GEO. (2018). List of Geothermal PowerPlants. Global Energy Observatory. https://globalenergyobservatory.org/list.php?db=PowerPlants&type=Geothermal
[3] Aghahosseini, A., & Breyer, C. (2020). From hot rock to useful energy: A global estimate of enhanced geothermal systems potential. Applied Energy, 279, 1. https://doi.org/10.1016/j.apenergy.2020.115769
[4] Coro, G., & Trumpy, E. (2020). Predicting geographical suitability of geothermal power plants. Journal of Cleaner Production, 267, 8-9. https://doi.org/10.1016/j.jclepro.2020.121874
Electricity: Wave and tidal power
The US Department of Energy projects that the worldwide potential of wave power is a staggering 29,500 TWh per year, with somewhere between 1,594 to 2,640 TWh per year just for the United States.[1] Wave power is an emerging technology that could contribute substantial grid-connected power, but not yet, and not without substantial investment. If we were able to capture even a portion of the potential of the wave energy available in the USA’s 12,383 miles of coastline, we might meet up to about a quarter of all US electricity needs.
Tidal power has about a quarter of the potential of wave power, or 7.5 to 10% of US consumption. Ocean currents and river currents have less potential, together offering perhaps 5 to 9% of US consumption.[2]
[1] DOE. (2019). Powering the Blue Economy: Exploring Opportunities for Marine Renewable Energy in Maritime Markets (p. 159). Office of Energy Efficiency and Renewable Energy. https://www.energy.gov/sites/default/files/2019/09/f66/73355-Appendices.pdf
[2] ibid
Electricity: transmission
In order to make the shift to 100% renewable electricity, the grid that delivers electricity to where it is needed will need a major overhaul. A so-called “smart power grid” (not to be confused with the 5G “smartphone grid”) would potentially save on wastage and losses in transmission, and would better optimize and balance the peaks and troughs of demand.[1]
Smart grids are networks of electricity that use advanced monitoring technologies to provide a more efficient, flexible, and reliable means of delivering energy. They have become a particularly important development at present, as less consistent energy sources such as wind and solar continue to become larger components of our grid. Smart grids are, in terms of research and development, a mature technology. The issue is how fast we can build them.[2] The transmission grid, which brings power from power stations to substations, is well-digitized (and therefore more amenable to becoming “smart”) while the distribution grid, which brings energy from substations to their final destination, is lacking digitization in much of the world. [3]
Some countries are quite far ahead in digitizing the distribution grid: China has 100% deployment of residential smart meters, while the EU lags behind at around 52%.[4] Still, yearly global investment has increased from $39 billion in 2015 to $64 billion in 2022, a trend which must continue if we are to adequately handle a greater share of clean energy and the growing risks of extreme weather events impacting the grid.[5]
[1] See Electric Power Research Institute. (2011). Estimating the Costs and Benefits of the Smart Grid. In smartgrid.gov (No. 1022519). https://smartgrid.gov/files/documents/Estimating_Costs_Benefits_Smart_Grid_Preliminary_Estimate_In_201103.pdf
[2] Drtil, M. (2023, July 11). Smart grids. IEA. https://www.iea.org/energy-system/electricity/smart-grids
[3] Drtil, M. (2023, July 11). Smart grids. IEA. https://www.iea.org/energy-system/electricity/smart-grids
[4] IEA. (2023, July 10). Deployment to date of residential smart meters, 2021. https://www.iea.org/data-and-statistics/charts/deployment-to-date-of-residential-smart-meters-2021
[5] IEA. (2023, July 10). Investment in digital infrastructure in transmission and distribution electricity grids, 2015-2022. https://www.iea.org/data-and-statistics/charts/investment-in-digital-infrastructure-in-transmission-and-distribution-electricity-grids-2015-2022
Electricity: Storage
Electricity demand varies hour by hour as well as seasonally because of peak requirements at certain times of the day or year. Currently, peak demand is met by an over-capacity of generating power that can be turned on and off as needed. Since the sun does not shine at night and the wind does not always blow, renewable energy sources are generally less useful in meeting peak demand when it is needed.
Current electricity generating capacity is about double the total demand required in order to meet peak time requirements. Some analysts have suggested that wind and solar capacity would need to be at least double this, or four times to total US electricity demand, in order to meet peak time requirements.[1] Others have suggested even more peak capacity would be needed, while another option for meeting the variable nature of electricity demand is through storage.
“Pumped storage hydropower” (PSH) refers to an energy storage method where water is pumped up a hill when energy demand is low and released down the hill to create hydroelectric power when energy demand is high. This allows energy that could otherwise be wasted during low-demand periods to be put to use during periods of high demand.
Already, a certain amount of peak demand is met through PSH at hydroelectric plants. Current plans to turn Hoover Dam into a “giant battery” involve using electricity from the dam to pump water back into the reservoir during off-peak times to allow more water to flow through the turbines at peak times.[2]
Even as battery costs are decreasing overall, PSH is still the “most cost-effective long-term electricity storage option”.[3] The US contains the largest portion of the 137 GW of PSH capacity worldwide, but further development of this technology has remained static for lack of profitability.[4]
A similar idea uses solid mass instead of water: when there is surplus energy, massive weights are lifted. When energy is needed, the weights are allowed to fall, using gravity to generate electricity in the process. Currently, abandoned and out-of-use mines present an opportunity for installation of gravity batteries with less extensive infrastructure needs.[5] At present, gravity batteries have higher efficiency compared to other non-standard battery large-scale energy storage methods and are also safer and more economical than standard batteries.[6] However, this technology is still in its infancy. Near Shanghai, the first commercial grid-scale gravity battery (with 25MW capacity) is currently being built and expected to be fully connected to the grid by the end of 2023.[7]
Industrial scale batteries are also being developed, and with the rapid fall in battery prices, this may become a viable option for meeting peak demand. The total energy stored at all utility scale battery storage sites in the US has been doubling every year, and as of the 4th quarter of 2022 was 25,185 MWh.[8]
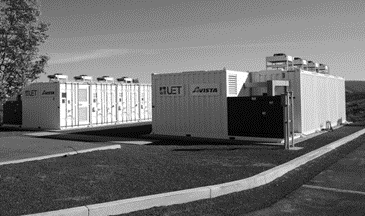
In the U.S., battery storage capacity is growing faster than utility-scale solar capacity, though much of this growth can be connected to the need to store the energy created by solar and wind power projects.[9] Vistra, a Texas energy company, has completed the third phase of its utility-scale “Moss Landing” battery storage facility. The facility has a capacity of 3,000 MWh, with 122 containers holding more than 110,000 battery modules.[10]
[1] See Hoste, G. R. G., Dvorak, M. J., & Jacobson, M. Z. (2020). Matching Hourly and Peak Demand by Combining Different Renewable Energy Sources A case study for California in 2020 (pp. 1–19). Stanford University. https://web.stanford.edu/group/efmh/jacobson/Articles/I/CombiningRenew/HosteFinalDraft
[2] Millar, A. (2018, December 3). Could the Hoover Dam become a giant battery? Power Technology. https://www.power-technology.com/features/hoover-dam-giant-battery/
[3] IEA (2021). Hydropower Special Market Report (p. 116). https://www.iea.org/reports/hydropower-special-market-report
[4] Schoenfisch, M., & Dasgupta, A. (2023, July 11). Energy storage. https://www.iea.org/energy-system/electricity/grid-scale-storage
[5] Hunt, J. D., et al. (2023). Underground Gravity Energy Storage: A Solution for Long-Term Energy Storage. Energies, 16(2), 825. https://doi.org/10.3390/en16020825
[6] Tong, W., et al. (2022). Solid gravity energy storage: A review. Journal of Energy Storage, 53, 20. https://doi.org/10.1016/j.est.2022.105226
[7] Energy Vault. (2023, August 1). Energy Vault Announces Commencement of Commissioning of World’s First EVxTM Gravity Energy Storage System. Energy Vault Holdings. https://investors.energyvault.com/news/news-details/2023/Energy-Vault-Announces-Commencement-of-Commissioning-of-Worlds-First-EVx-Gravity-Energy-Storage-System/default.aspx
[8] Colthorpe, A. (2023, February 28). US installed grid-scale battery storage capacity reached 9GW/25GWh in “record-breaking” 2022. Energy Storage News. https://www.energy-storage.news/us-installed-grid-scale-battery-storage-capacity-reached-9gw-25gwh-in-record-breaking-2022/
[9] From 2010 to 2015 solar capacity grew from under 1 GW to 13 GW, while from 2020 to 2025 battery storage is expected to increase from 1.5 GW to 30 GW.
Ray, S. (2022, December 8). U.S. battery storage capacity will increase significantly by 2025. U.S. Energy Information Administration. https://www.eia.gov/todayinenergy/detail.php?id=54939
[10] Vistra. (2023, August 1). Vistra Completes Milestone Expansion of Flagship California Energy Storage System. Vistra Corp. https://investor.vistracorp.com/2023-08-01-Vistra-Completes-Milestone-Expansion-of-Flagship-California-Energy-Storage-System
[11] PHOTO: Wikimedia Commons
[1] IEA. (2022). World Energy Outlook 2022. (p 438). IEA. https://iea.blob.core.windows.net/assets/830fe099-5530-48f2-a7c1-11f35d510983/WorldEnergyOutlook2022.pdf
[2] This number would require overcoming “several practical barriers.” See
Archer, C. L. (2005, June 30). Evaluation of global wind power. Journal of Geophysical Research, 110(D12), 1. https://doi.org/10.1029/2004jd005462
[3] Veronesi, F., et al. (2016). Estimation of the Global Solar Energy Potential and Photovoltaic Cost with the use of Open Data. DOAJ (DOAJ: Directory of Open Access Journals), 9, 1. https://www.researchgate.net/publication/292991459_Estimation_of_the_Global_Solar_Energy_Potential_and_Photovoltaic_Cost_with_the_use_of_Open_Data
[4] Hoes, O. A. C., Meijer, L. J. J., van der Ent, R. J., & van de Giesen, N. C. (2017). Systematic high-resolution assessment of global hydropower potential. PLOS ONE, 12(2), 1. https://doi.org/10.1371/journal.pone.0171844
[5] Aghahosseini, A., & Breyer, C. (2020). From hot rock to useful energy: A global estimate of enhanced geothermal systems potential. Applied Energy, 279, 1. https://doi.org/10.1016/j.apenergy.2020.115769