More from Chapter 5: Generating Electricity –>
Batteries –>
To Chapter 6- Climate Solutions (part 2) for 2050 –>
The bottom line on climate is that the world is currently spewing out roughly 60 Gigatons (GtCO2-eq) of carbon into the atmosphere per year.[1] To save the planet, we’ve got to get that figure down to 30 Gigatons (GtCO2-eq) by 2030, and then to net-zero Gigatons (GtCO2-eq) by 2050. What will it take to reach those figures?
We know that nearly a quarter (23%) of total global carbon emissions (13.8 GtCO2-eq) come from the generation of electricity.[1] That is the largest single share of emissions from any source and clearly the number one priority for addressing the climate crisis. If the world stopped burning fossil fuels to generate electricity, that alone would take emissions down to roughly 45 GtCO2-eq.
Another 10% of total emissions come from cars and trucks on the road (6.1 GtCO2-eq). Urgently reducing the use of gasoline and diesel for ground transportation, added to the reductions from electricity, could bring the total down by a third, to 39 GtCO2-eq.
Roughly 6% of emissions (3.3 GtCO2-eq) are from the use of fossil fuels (mostly gas) to heat buildings.[2] If we were able to eliminate all emissions from just these three areas alone (electricity, cars and buildings) that would bring global emissions down to 35.8 GtCO2-eq.
The rapid and widespread transition away from fossil fuels for electricity, cars and buildings is an absolute top priority if we want to reduce emissions by 2030 and save the planet. These reductions alone are not quite enough to get us down to 30 GtCO2-eq, but drastically reducing the world’s reliance on fossil fuels would trigger other reductions which could get us to 30 GtCO2-eq.
That’s because the production, transportation and processing of oil and gas itself causes at least 4.7 GtCO2-eq of additional emissions before any of it is actually burned for fuel.[3] These include accidental releases as well as intentional venting and flaring in oil refineries and other fossil fuel infrastructure. And another 1.3 GtCO2-eq is emitted in the process of mining for coal. If we stop burning coal for fuel, we should be able to also eliminate those upstream emissions.[4] So if the world were no longer burning fossil fuels to produce electricity, run vehicles, or heat buildings, these upstream emissions would no longer be happening. Adding these emissions to our existing reductions would get us to our target of just below 30 GtCO2-eq (29.8 GtCO2-eq).
Table 5.1 Potential emission reductions to reach 30 GtCO2-eq
| Source of carbon emissions per year | Potential reduction per year | Remaining emissions per year |
| Global emissions 2019[5] | 59.0 | |
| Electricity generation | -13.8 | 45.2 |
| Ground transportation | -6.1 | 39.1 |
| Heating of buildings | -3.3 | 35.8 |
| Oil and gas infrastructure | -4.7 | 31.1 |
| Coal mining fugitive gases | -1.3 | 29.8 |
Could we transition the entire world off coal, gas and oil-fired power plants, off cars and trucks running on gasoline and diesel, and off gas and oil to heat buildings by 2030? We have the technologies and we have the know-how to implement them. But even with all the money and political will in the world, it would be difficult.
It takes time to build and install solar panels, construct windmills, produce and deliver electric vehicles and heat pumps. So in addition to a major focus on electricity, cars and buildings, we also need to take some additional steps to ensure we can meet the goal of 30 GtCO2-eq by 2030. These include further emission reductions in industry and transitioning off hydrofluorocarbons (HFCs).[6]
Table 5.2 Potential emission reductions to reach 30 GtCO2-eq – including low-temperature industrial uses and HFCs
| Source of carbon emissions per year | Potential reduction | Remaining emissions |
| Global emissions 2019 | 59.0 | |
| Electricity generation | -13.8 | 45.2 |
| Ground transportation | -6.1 | 39.1 |
| Heating of buildings | -3.3 | 35.8 |
| Oil and gas infrastructure | -4.7 | 31.1 |
| Coal mining fugitive gases | -1.3 | 29.8 |
| Low temp industrial uses | -4.0 | 25.8 |
| HFCs | -1.4 | 24.4 |
By focusing almost exclusively on drastic reductions in the burning of fossil fuels for producing electricity, transportation and heating of buildings (plus conversion of low temperature industrial processes and phasing out of HFCs), the world could potentially reduce carbon emissions by more than 35 GtCO2-eq, bringing them down to 24 GtCO2-eq. That should allow plenty of leeway for meeting the goal of reducing carbon emissions to no more than 30 GtCO2-eq by 2030. But of course, it means making those reductions in the next 6-7 years, starting as soon as possible.[7]
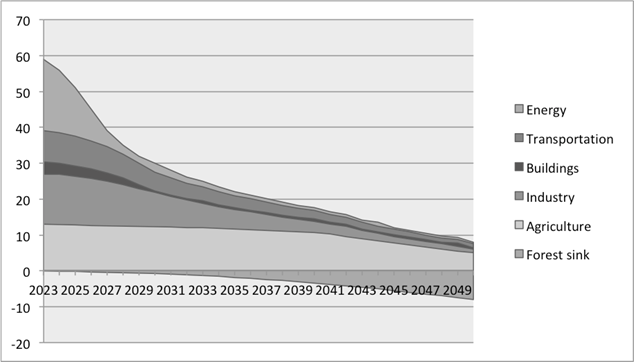
To make it to 2050 without climate catastrophe, we must make immediate reductions in the energy, transportation and building sectors.
The stylized chart below shows global emissions dropping rapidly to reach the goal of 30 GtCO2-eq by 2030 and then reducing more slowly to reach around 8 GtCO2-eq of emissions coupled with 8 GtCO2-eq of sequestered carbon to reach net-zero by 2050. The major transformations needed in industry and agriculture are more difficult and will take time.
Figure 5.1 Global emission reductions needed to 2030 and 2050 by sector[8]
Generating electricity
How much of the 13.8 GtCO2-eq of emissions from the generation of electricity worldwide can we realistically cut by 2030? The IPCC suggests 11.0 GtCO2-eq could be cut from electricity by 2030, and that includes increased reliance on nuclear power and biomass plants. But others have proposed very detailed plans for moving the world to 100% electricity from wind, water and sun. The only question is how quickly can it be done?[9]
We can reduce the overall demand for electricity with better insulation of buildings, more efficient light bulbs, and other energy conservation measures, but there is no scenario for addressing the climate crisis that does not involve a significant increase in the use of electricity worldwide in order to eliminate the use of fossil fuels in other areas.
Extra electricity needed
A lot of the energy produced by burning fossil fuels (and nuclear fuel) is wasted in the form of excess heat. This heat can be used to warm the inside of your car, for instance, or to heat buildings, but otherwise most of that heat is just dissipated and cannot be put to productive use. Electricity, on the other hand, is considerably more efficient.[10]
The conversion to electricity means considerably less energy is required overall to move a car or to run a machine. Nevertheless, that conversion still means a significant increase in the amount of electricity that will be needed to run electric cars, heat buildings and so on[11] as fossil fuels are phased out.
Electricity is measured in a number of different ways. The amount it takes to light a lightbulb or to run a piece of equipment is normally counted in Watts, Kilowatts (=1,000 watts, or kW), megawatts (= 1,000 kW, or 1 MW), gigawatts (= 1,000 MW, or 1 GW) or Terrawatts (=1,000 GW, or 1 TW). The “capacity” of a power plant or wind turbine or solar panel is also measured in watts, kW, MW, GW or TW. But the actual amount of electricity produced or consumed is usually measured against the amount of time involved, for instance, in hours: kWh, MWh, GWh, or TWh.
Electric vehicles currently consume approximately 0.2-0.34 kWh of electricity per mile of travel. Gasoline powered vehicles in the US currently travel approximately three trillion miles per year. So if all those vehicles were powered instead by electricity, that would be an additional 600-900 TWh of electricity generation needed by 2050 on top of the existing load of approximately 4,000 TWh per year.
Currently in the US, approximately 116 million homes are heated with gas. Homes vary enormously in size and energy efficiency, but assuming it takes, on average, about 10,000 kWh per year to heat a home with electricity, that is an additional 1,160 TWh of electricity to be added to the existing load per year for home heating.
With conversion of vehicles and home heating, that brings the total electricity needs of the United States up from 4,000 to over 6,300 TWh per year by 2050, or roughly 50% more than we use at present. Energy conservation measures would help, but to present a viable alternative to fossil fuels, renewable energy sources need to be able to meet the expected future energy needs.
Table 5.3 Calculating future US electricity needs[12]
| In TWh | 2021 | 2030 | 2050 |
| Existing electricity consumption | 3,930 | 4,200 | 4,400 |
| Added electricity needed for vehicles | – | 234 | 750 |
| Added electricity needed for heating | – | 68 | 1,160 |
| Total electricity needs | 3,930 | 4,502 | 6,310 |
Extrapolating these figures to other countries is difficult, because the world is so unevenly and unfairly divided. Per capita electricity consumption varies enormously, as does car usage and the need for heating. Taking all these factors into account, the International Energy Agency (IEA) assumes a maximum increase in global electricity usage of 150% by 2050.[13] That would bring total global electricity production up from 24,700 TWh to roughly 62,000 TWh by 2050.[14]
Table 5.4 Calculating future global electricity needs[15]
| In TWh | 2021 | 2030 | 2050 |
| Existing global electricity consumption | 24,700 | 24,700 | 24,700 |
| Added electricity needed for transportation | – | 1,700 | 9,800 |
| Added electricity needed for heating | – | 900 | 3,300 |
| Added international development needs | – | 3,700 | 11,500 |
| Total electricity needs | 24,700[16] | 33,700 | 62,100 |
Where we are now
Globally, fossil fuels still account for more than 60% of current electricity production, with coal producing 36% (10,201 TWh[17]), followed by natural gas at 23% (6,552 TWh) and oil at 2.5% (682 TWh). Nuclear power accounts for about 10% of all electricity (28,334 TWh).
That leaves more than one quarter of all electricity globally that is already produced by “renewable” sources. These include hydroelectric power at 15% (4,327 TWh), wind at 6.5% (1,870 TWh) and solar PV at 3.5% (1,003 TWh). The rest, at 3% (923 TWh), includes other types of solar power, geothermal, etc., but also biomass, which for our purposes does not count as “clean” energy (see above).[18]
Figure 5.2 Global sources of electricity generation[19]
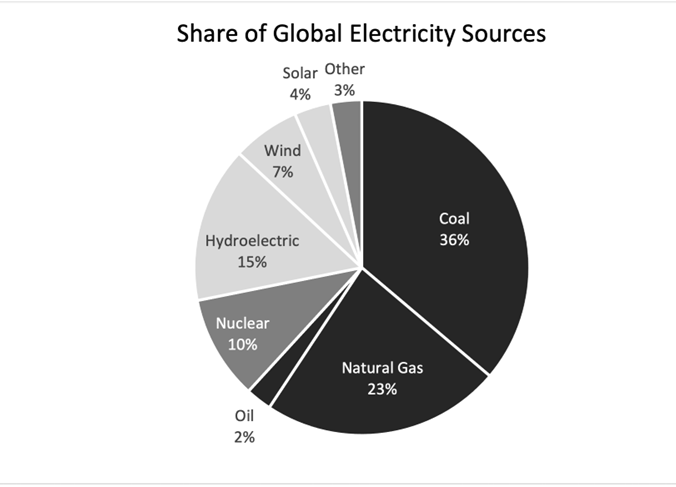
Table 5.5 Global electricity generating capacity and yearly production
by source – 2022[20]
| Electricity Source | Capacity in GW | Production in TWh |
| Coal | 2,184 | 10,201 |
| Natural Gas | 1,850 | 6,552 |
| Oil | 292 | 682 |
| Nuclear | 413 | 2,776 |
| Biomass and other | 364 | 923 |
| Hydroelectric | 1,358 | 4,327 |
| Wind | 832 | 1,870 |
| Solar | 892 | 1,003 |
| TOTAL | 8,185 | 28,334 |
[1] Technically, this category of emissions includes electricity “and heat,” because heat from burning fossil fuels is used to run steam turbines that produce electricity, and the heat can also used to heat buildings, including entire college campuses or even whole towns. The electricity and heat category is also just a portion of the “energy supply” category, which includes fugitive emissions from coal mines, gas and oil flaring, etc as well as from oil refineries and pipelines, etc. See Chapter 3 and also IPCC, AR6 Summary for Policy Makers, pg. 12. https://www.ipcc.ch/report/ar6/wg3/downloads/report/IPCC_AR6_WGIII_SPM.pdf
[2] See chapter 3 for explanation and source of all these figures.
[3] According to the IEA, the figure is 5.1 GtCO2-eq, but we are using IPCC figures here, from Table 3.4. See IEA. (2023). Emissions from Oil and Gas Operations in Net Zero Transitions. (p. 8–9). https://iea.blob.core.windows.net/assets/2f65984e-73ee-40ba-a4d5-bb2e2c94cecb/EmissionsfromOilandGasOperationinNetZeroTransitions.pdf
[4] IEA. (2023). Strategies to reduce emissions from coal supply – Global Methane Tracker 2023 – Analysis. https://www.iea.org/reports/global-methane-tracker-2023/strategies-to-reduce-emissions-from-coal-supply
[5] 2019 is the latest year with up-to-date emissions figures for the whole world.
[6] See pages 94-95.
[7] There are other possible ways to cut the cake, but all of them involve in the first instance making deep cuts in each of the areas outlined above. The IPCC has their own choices and priorities, based on different assumptions about what is “possible” from a political and industry perspective. As a comparison, their cuts between now and 2030 involve fewer reductions in the seven key areas above, and therefore require additional reductions from agriculture and waste. See Slade, R., et al. (2022). Climate Change 2022: Mitigation of Climate Change. In P. R. Shukla & J. Skea (Eds.), Intergovernmental Panel on Climate Change (p. 1257). Working Group III. https://www.ipcc.ch/report/ar6/wg3/
[8] Data based reducing emissions in relevant sectors to reach IPCC goals for 2030 and 2050
[9] See Jacobson, M. Z., et al. (2022). Low-cost solutions to global warming, air pollution, and energy insecurity for 145 countries. Energy & Environmental Science, 15(8), 3343. https://doi.org/10.1039/d2ee00722c
[10] Ibid, p. 3347.
[11] For more discussion of this question, see the work of Mark Jacobson (2014, 2018, 2020, 2022). Given that 10% of the world’s population don’t even have access to electricity yet, we are going here with the assumption that more rather than less electricity will be needed in the future.
[12] Data based on calculations in the text above.
[13] See IEA. (2022). World Energy Outlook 2022. https://iea.blob.core.windows.net/assets/830fe099-5530-48f2-a7c1-11f35d510983/WorldEnergyOutlook2022.pdf
[14] IEA. (2022). World Energy Outlook 2022 (p. 281). https://iea.blob.core.windows.net/assets/830fe099-5530-48f2-a7c1-11f35d510983/WorldEnergyOutlook2022.pdf
[15] Data from IEA, ibid.
[16] Current global electricity needs are roughly 24,700 TWh per year, but actual electricity production capacity from all sources is 28, 300 TWh per year. This is because utilities want sufficient capacity to meet peak demands and to ensure adequate supply when power plants are down for repair, etc.
[17] An electricity source generating 1 GW of power, if running continuously for a year would generate 8.76 TWh of electricity (1 GW x 8,760 hours in a year= 8,760 GWh or 8.76 TWh)
[18] Ibid.
[19] Data from IEA. (2022). World Energy Outlook 2022 (p. 438).
[20] See IEA. (2022). World Energy Outlook 2022 (p. 438). https://iea.blob.core.windows.net/assets/830fe099-5530-48f2-a7c1-11f35d510983/WorldEnergyOutlook2022.pdf