Jump to: Emissions Omissions ~ Direct vs. Indirect emissions ~ Carbon Footprinting ~ Variations in Numbers ~ Breaking Down Sources (US / Global) ~ Net Zero by 2050
Most people now are at least dimly aware that without immediate and concerted action to address it, climate change poses an existential threat to humanity. However, one of the reasons we are still not seeing the immediate and concerted action needed is that there is so much genuine confusion, as well as deliberate obfuscation, surrounding the whole climate issue.
For decades, the fossil fuel industry has engaged in campaigns of misinformation and denial, sowing doubts among the public as to whether climate change was even real, and if it was, that is was being caused by human activity, and even if it was, that it had anything to do with the burning of fossil fuels.[1] (Chapter 16 looks very specifically at industry efforts to convince US politicians to downplay the dangers of climate change and to avoid taking the steps needed to address it.)
These efforts have involved industry-funded think-tanks and research institutes pumping out propaganda disguised as science.[2] They have involved national and international non-profit organizations promoting industry solutions disguised as climate action. And they have involved targeting influential individuals within the climate movement to soften or adapt their messaging to suit the goals of the industry (an effort that has failed spectacularly in the case of Greta Thunberg).
It is hugely important to be able to sift through the massive amount of climate rhetoric and identify what is real science and what is essentially propaganda from the profiteers.
Whose carbon?
If we want to address the climate crisis, we have to cut carbon emissions. But the first problem is knowing where those carbon emissions are actually coming from. When companies and whole countries can “offset” their emissions or effectively “buy” their right to keeping pumping out emissions but pretend those emissions are coming from another actor,[3] how do we know where to focus our efforts?
It is nothing but pure greenwashing for an airline company like Delta to claim to be carbon-neutral.[4] But carbon credits, carbon offsetting, carbon cap and trade have been big business for years, enabling companies and institutions to continue pumping the same amount of carbon into the atmosphere while claiming to be reducing it.
The mechanisms by which companies and countries buy and sell their carbon emissions are complex and confusing in themselves, but they should not distract us from the big picture of how much carbon is going into the atmosphere every year, and how much and when we need to reduce that by if we are going to avert climate catastrophe.
Emissions omissions
There are other ways in which carbon emissions are hidden or obscured. One of the most glaring is the figure for emissions from burning biomass (see Chapter 4). Wood, wood pellets, other agricultural waste and even residential waste are increasingly used as fuel for generating electricity. Corn and other agricultural products are also turned into ethanol, or “biofuel,” and used as a fuel for cars and trucks.
When biomass or biofuel is burned, it emits as much carbon as burning coal or oil. And yet these emissions are not normally counted in the national tallies of carbon emissions on the theory that biological products like wood and food waste are constantly being renewed by planting trees and crops, thus neutralizing any effect they may have on climate. This is a flawed argument (see Chapter 4) and “explains” some of the discrepancies in terms of emissions reporting.
Bunker fuels
“Bunker fuels” are fuels used for international flights and international shipping. By general agreement, these are not counted as part of a country’s national inventory of carbon emissions since the emissions take place outside that country. They are, however, counted separately, at least in the IPCC figures, and add another 2% or so onto the total carbon emissions accounted for globally.[5]
Military emissions
Wars use up an enormous amount of fossil fuel, but military emissions are generally excluded from national reporting on grounds of national security. And when wars are fought on someone else’s territory (like all of the many wars the United States has fought since 1865), the carbon emissions are not claimed by the countries fighting abroad, nor are they likely to be claimed by the countries where the war is taking place (for example, Iraq or Afghanistan).
Some studies have suggested that emissions from US-led wars and war preparations dwarf emissions emanating from other sectors.[6] The Costs of War Project at Brown University has estimated total carbon emissions from the so-called “War on Terror” to be about 1.3 GtCO2-eq[7] from 2001-2018, based on available data on US military consumption of jet fuel, diesel, gasoline, electricity, etc. Some of those emissions will have been reported through the US Inventory but much of it was not. Note that the report relies on the carbon footprint approach (see next section), which may involve some double-counting.
Based on fuel usage and other public data, the Cost of War Project estimated total US military emissions in 2017 alone to be 25.4 MMT CO2-eq.[8] It is not clear whether this is fully included in the US Inventory of Emissions and Sinks (see table later in this chapter), but the total for “other aircraft” in 2019 was reported as 45.6 MMT CO2-eq, so the military component could well be within that amount.
As a single source, US military emissions are larger than the emissions of most countries in the world.[9] But in relation to other sources of US emissions, the military represents less than 0.5% of the total. And in terms of global emissions, the US military amounts to about 0.04% of the total (see global emissions table later in this chapter).
So are US military emissions a huge part of the problem or not? It’s impossible to know exactly how much carbon the US military actually emits. We need accurate and universal reporting of these emissions. Certainly these emissions are significant enough to be more carefully monitored and reduced in line with all other emissions that are endangering the planet.
Direct vs indirect emissions
“Direct” emissions come from a specific source (like the fumes from your home oil furnace). “Indirect” emissions come from a secondary source (like the carbon emitted at electricity-generating plants that you use to power your lights and air conditioner). Combining these into one measurement complicates our ability to discern where emissions are coming from, and where to focus our efforts to eliminate them.
For example, building sector totals may include direct emissions from fuel being burned to heat a building as well as indirect emissions from the amount of electricity being consumed for appliances. This results in buildings often being regarded as contributing 16% of total carbon emissions, when in fact direct emissions are only 6% of the total. Similarly, industry is often regarded as having 34% of total carbon emissions, when in fact direct emissions are only 24% of the total.[10]
Since electricity may be generated from fossil fuels or from clean, green sources like wind or solar, it is confusing to lump all those emissions in with those coming directly from the building itself, such as from the gas used for heating and cooking.
It becomes even more confusing when the indirect emissions from electricity usage are included in the figures for industry, since the challenges associated with decarbonizing certain industrial processes are very different from the challenges of decarbonizing the electricity supply (see below).
The problem is that the main climate culprit – generating electricity from fossil fuels – can be obscured and minimized. And that’s not the only problem with calculating emissions.
Table 3.1 Global Emissions when electricity is included vs not included[11]
| Sector | GtCO2-eq Direct emissions | Percentage Direct emissions | GtCO2-eq Including electricity | Percentage Including electricity |
| Energy | 20.0 | 34% | 7.1 | 12% |
| Industry | 14.0 | 24% | 20.1 | 34% |
| Agriculture, Forest, Land | 13.0 | 22% | 13.0 | 22% |
| Transportation | 8.7 | 15% | 8.9 | 15% |
| Buildings | 3.3 | 5% | 9.4 | 16% |
| TOTAL | 59.0 | 100% | 58.5 | 100% |
Carbon footprint
A popular way of looking at carbon emissions is by way of carbon “footprints,” which build on the concept of indirect emissions. Carbon footprints look at a particular human activity, like eating meat or flying by airplane, and then break down all the steps and processes involved in that activity to derive a composite figure for all the carbon emissions involved along the way.[12]
It can be helpful to understand how any one category of direct carbon emissions is also contributing to other emissions more indirectly. For instance, driving a car is directly emitting carbon dioxide by burning gasoline in the car engine. But there were also carbon emissions involved in manufacturing the car, in processing the gasoline, in constructing the roads and so on. Adding all these other factors together gives us a more accurate “carbon footprint” of driving a car.
What can be unhelpful, however, is to then try to compare the carbon footprint of a gasoline-powered car with that of an all-electric car. That is because we are still operating in a fossil-fuel economy where nearly every step of nearly every industrial process involves the burning of fossil fuels, whether it is to dig the raw materials out of the ground, to make the electricity to run a car factory, to power the trucks that transport the cars, to build the roads to drive on, etc.
If our goal is to reduce and eliminate carbon emissions, we must look at the end result we are trying to reach and figure out how to get there. Gasoline and diesel-powered cars are responsible (together with SUVs) for at least 10% of carbon emissions globally and over 15% of total carbon emissions in the US.[13] We simply cannot move to a clean, green economy without eliminating this source of carbon emissions. For example, we could be aiming for:
- fewer cars on the road, as a result of improved public transport systems
- cars, buses and trains that are powered by electricity and not fossil fuels
- ensuring that the electricity powering cars, buses and trains comes only from clean, green sources
- cars, buses and trains that are manufactured using energy only from clean, green sources
- cars, buses and trains that are built out of materials that are mined and prepared only from clean, green sources
- cars, buses and trains built out of materials that can be reused and recycled to eliminate waste products
And so on.
Once those broader goals are achieved, EVs will have a much better carbon footprint than gasoline cars, but in the transition to reaching that point, it might not be so clear.
Similarly, it might be pointed out that the carbon footprint of putting solar panels on your roof appears to be not much better than the carbon footprint of pumping electricity into your house from a gas-fired power plant. Once again, that would be highly misleading, since we cannot move to a clean, green economy without eliminating the carbon emissions from gas-fired power plants.
During the transition from where we are now to where we are trying to get, the materials to make solar panels are invariably dug out of the ground using fossil fuels, they are constructed in factories powered by fossil fuels, then transported on ships powered by fossil fuels, and so on. But once these other steps in the process are also transitioned off fossil fuels and are instead powered by green, clean energy sources, the carbon footprint of solar panels vs gas-fired power plants will be dramatically different. Again, the end goal here would be:
- Electricity produced by solar, wind and other clean, renewable sources
- Solar panels that are manufactured using only electricity
- Ensuring that the electricity used to make solar panels comes only from clean, green sources and not fossil fuels
- Solar panels that are sourced from recycled materials and mines that do not use fossil fuels (or other environmentally or socially damaging practices)
- Solar panels that are transported to your roof using only fossil-free transportation
- Solar panels that can be reused, recycled and retained to eliminate waste products
And so on.
Carbon footprints can also distort our priorities for addressing the climate crisis. As with the examples above, the carbon footprint of flying or eating red meat has convinced many climate activists that one of the most important things you can do as an individual to help prevent climate catastrophe is to stop flying and/or to become a vegan.
Flying
Airplanes consume large amounts of jet fuel to get us from one place to another. A Boeing 747 burns about 5 gallons of fuel per mile and so it consumes about 21,800 gallons to cross the Atlantic.[14] Burning one gallon of jet fuel produces 21.1 pounds of CO2, so that’s roughly 230 tons of CO2 for each trans-Atlantic crossing. Even if that is divided by 500 passengers, that is roughly 1,000 pounds of CO2 per person per crossing, or roughly equivalent to driving a car for 1,000 miles.
Flying long distance is therefore quite rightly considered a carbon-intensive activity and quite possibly the single most carbon-intensive activity any one person can undertake. However, the attention given to this one item far outweighs its importance in the grand scheme of things. Globally, aviation accounts for less than 2% of total carbon emissions.[15] This is by no means insignificant, and to reach net zero, the world will certainly have to address the emissions from aviation.
However, given that road transportation, electricity generation and the heating of buildings between them account for nearly 40% of all greenhouse gas emissions,[16] the contribution from aviation is comparatively small, even if the carbon footprint of flying looks very large when viewed from the perspective of a single person.
Diet
Cattle and other ruminants emit methane, a potent greenhouse gas, as part of their digestive process. The average cow produces as much as 250 pounds of methane per year.[17] With over 1.5 billion cattle raised for meat production worldwide, that adds up to a lot of methane: as much as 5% of total CO2-eq emissions per year globally.[18] In the US, cattle account for only about 2.5% of total emissions. This is still significant, but not as significant as the “50% less carbon emissions of a vegan diet” claimed by the Vegan Society.[19]
Once again, the carbon footprint model assumes that emissions from meat are not just caused by belching cattle, but also by cutting down forests to make way for cattle ranches, fuel for tractors, use of fertilizers and pesticides, refrigeration and transportation of meat products over great distances, etc. When you add all these additional factors, meat indeed becomes a high-carbon food to be consuming.
But if cattle are grazed on natural grasslands, and if tractors, ships and trucks are fuelled with green electricity, and if other transitions to the green economy have occurred, meat becomes much less of a carbon-intensive food than it is now. There are still good reasons to become vegan or to eat less meat from a health or animal welfare perspective, but in terms of addressing climate change, reducing the methane emissions of cows is comparatively low on the list of urgent priorities.
In general, carbon footprint calculations are based on the assumption that all the steps and processes involved in making a certain activity possible are consuming fossil fuels at the current rate. If and when that is no longer the case, all those calculations will have to change, and with them the relative merits of certain activities over others from a climate perspective.
Variations in the numbers
There are a number of methods for counting total global direct carbon emissions, and each comes up with different numbers. Some refer to emissions of carbon dioxide only, and omit emissions from the other greenhouse gases, primarily methane (CH4), nitrous oxide (N2O), and hydrofluorocarbons (HFCs or “F-gases,” of which there are many).[20]
Even when all greenhouse gases are included, there are variations in what is being included or not. We’ve already mentioned bunker fuels, military emissions, and handling of electricity as complicating factors. Other variations are due to figures that refer only to greenhouse gases emitted from the energy and industrial sectors and omit those coming from agriculture and changing land use.[21]
Even the definition of what counts as the “fossil fuel industry” seems to vary, with some sources including waste and biofuels, and others not. Some include cement production but not other industrial processes. The variations are seemingly endless and enormously unhelpful when it comes to trying to make sense of the numbers.
The Land Use, Land-use Change and Forestry (LULUCF) category is used to measure the net effects of deforestation, draining of wetlands and other human activities on the terrestrial “sinks” that would otherwise be removing greenhouse gases from the atmosphere.[22] However, there are two very different approaches to measuring LULUCF, and these can produce quite different results.[23]
And because national reporting of carbon emissions can be problematic, and other sources vary in what they include or don’t include, the remaining figures in this book are all from the Intergovernmental Panel on Climate Change (IPCC), the global authority on global warming potential and the science behind climate change. We also focus our attention on data from 2019, so as to not include anomalous data from the year 2020 when the world shut down because of the COVID pandemic. Emission figures more recent than 2020 are still incomplete.
Table 3.2 Variations in reporting of total global greenhouse emissions
| Source | GtCO2-eq | Co2 only | All gases | GtCO2-eq |
| coal | 14.9 | |||
| Gas | 7.2 | |||
| oil | 11.6 | |||
| Biofuels | 0.5 | |||
| Energy/Fuel combustion | 34.3 | 34.3 | ||
| Bunker fuels and waste | 3.7 | |||
| CO2 – FFI | 38.0 ± 3.0 | 36.95 | 38.0 ± 3.0 | |
| Methane – FFI | 8.65 | 6.8 ± 3.2 | ||
| Nitrous oxide | 3.10 | 2.7 ± 1.6 | ||
| F-gases | 1.18 | 1.4 ± 0.4 | ||
| CO2 – LULUCF | 6.6 ± 4.6 | |||
| Methane-LULUCF | 4.2 ± 1.3 | |||
| TOTAL | 34.3[24] | 38.0 | 49.8 | 59.0 ± 6.6 |
| source | IEA[25] | EDGAR[26] | WRI[27] | IPCC[28] |
All carbon emissions are shown here either in Million Metric Tons (MMT) or Billion metric tons, i.e. Gigatons (Gt) of carbon dioxide. The unit “CO2-eq” means we are using the latest IPCC GWP100 to convert other greenhouse gases to their equivalent amount of carbon dioxide.[29]
According to the table on the previous page, if we want to talk about the total global emissions of CO2-eq, we need to be using the IPCC figures. And as of 2019, that total was roughly 59 GtCO2-eq. [30] According to the IPCC again, that is the figure we need to get down to 30 GtCO2-eq by 2030 and to net-zero by 2050.
And in order to do that, we have to know exactly where all those emissions are coming from, because each source requires its own strategy for making effective reductions. Putting solar panels on rooftops, for instance, can address the emissions from fossil fuel burning electricity generating stations. But they will not address the emissions coming from gas boilers that are heating those same buildings.
Breaking down the source of carbon emissions
The IPCC collects emissions data from many sources and provides some useful breakdowns of where these emissions are coming from. When it comes to information provided by the biggest countries, emissions are divided into five “economic sectors:” energy, industry, agriculture (including land use and forestry), transport and buildings. So we know the total amounts for these sectors.
Table 3.3 Global carbon emissions by economic sector – 2019[31]
| Sector | GtCO2-eq | Percentage |
| Energy | 20.0 | 34% |
| Industry | 14.0 | 24% |
| Agriculture, Forest, Land | 13.0 | 22% |
| Transportation | 8.7 | 15% |
| Buildings | 3.3 | 5% |
| TOTAL | 59.0 | 100% |
We know from this table that globally, roughly 15% (8.7 GtCO2-eq) of emissions came from the transportation sector, for instance. But we don’t know how much of that is from cars and trucks on the road, how much from air travel, how much from trains or ships.
We know that 13 GtCO2-eq of emissions came from agriculture, forestry and land use, but we don’t know how much of that was from belching cows, how much from forest fires, how much from poor soil management, etc.
Getting down to the fine details of where emissions are coming from is essential if we want effective strategies for reducing those emissions. At the national level, we can get that level of detail, but at the international level it is more difficult.
US Figures
The US Environmental Protection Agency is responsible for reporting to the UN on US carbon emissions every year. Annoyingly, the categories are inconsistent between reporting agencies. For example, the US reports “electricity generation” as a major category and does not have “energy” as a category at all, whereas globally, “electricity” is a subcategory of “energy.” Similarly, the US reports coal mining emissions under “industry,” while globally they’re listed under “energy.” And…this can all change at any time.
Table 3.4 Global vs. US emissions by economic sector, 2019[32]
| Sector | Global GtCO2-eq | Global Percentage | US GtCO2-eq | US Percentage |
| Energy | 20.0 | 34% | 1.65 | 25% |
| Industry | 14.0 | 24% | 1.57 | 24% |
| Agriculture, Forest, Land | 13.0 | 22% | 0.66 | 10% |
| Transportation | 8.7 | 15% | 1.88 | 28% |
| Buildings | 3.3 | 5% | 0.84 | 13% |
| TOTAL | 59.0 | 100% | 6.60 | 100% |
But helpfully, the US reporting includes a level of detail that is not available from the IPCC or other global datasets.
From the tables on the next two pages, you can see that total gross (official) emissions from the US in 2019 amounted to 6,617.9 MMT (or 6.6 GtCO2-eq) in 2019 (line 75).[33] There is then a net reduction of 704 MMT of carbon from the LULUCF sector (line 76), meaning that forests and wetlands in the US absorbed that much carbon dioxide back out of the atmosphere. That left the US with overall “net” emissions of 5,913.9 MMT (5.9 GtCO2-eq) (line 77).
Table 3.5 US Emissions by economic sector and major sub-categories[34]
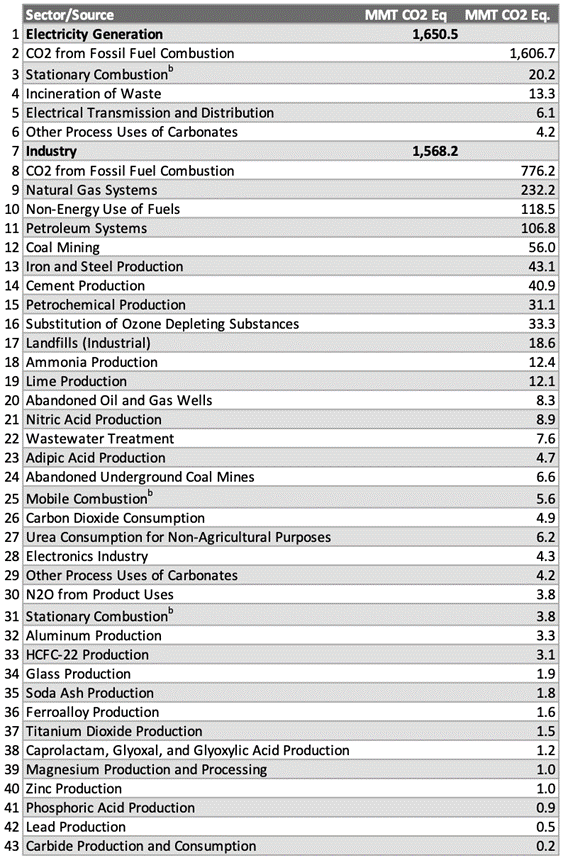
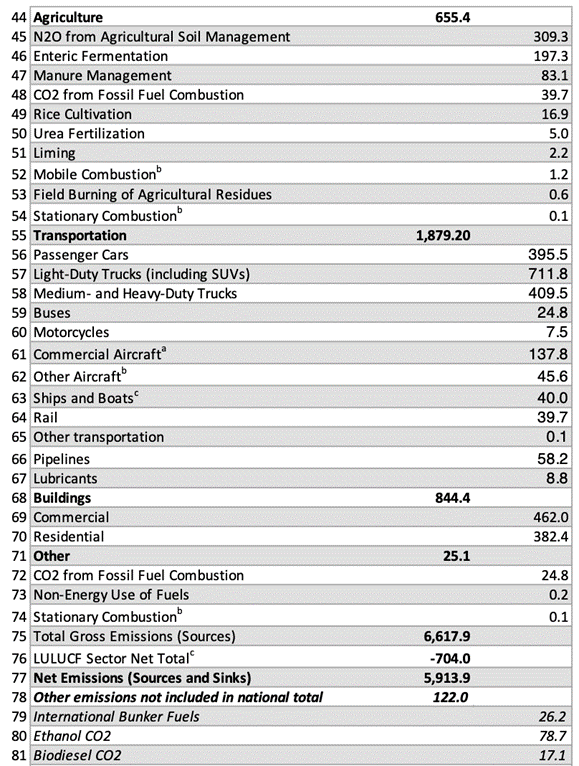
Getting into the weeds, you can see the main economic sectors in bold, showing 1,879.2 total emissions from the transportation sector (line 55),[37] 1,650.5 from the electric power sector (line 1), 1,568.2 from industry (line 7), 655.4 from agriculture (line 44) and so on.
Digging even deeper, this chart shows us that “passenger cars,” for instance, accounted for 395.5 MMT of emissions within the transportation sector (line 56) and “light-duty trucks” accounted for another 711.8 MMT of emissions (line 57). Although the definition of light-duty trucks includes pick-up trucks, the vast majority of emissions from this sector come from SUVs,[38] which are not considered passenger cars in this accounting system but are counted as trucks.
There are now many more SUVs in the US than non-SUV cars, so total emissions from the broader “car” category would be much closer to the total of these two amounts, or roughly 1.1 GtCO2-eq in 2019. Adding other road vehicle categories (lines 58, 59 and 60) would give us a total of 1,549.1 MMT for emissions from ground transportation in the US.
By comparison, you can see methane emissions from cows (“enteric fermentation,” at least in the US, came to just 197.3 MMT (line 46), which is less than 3% of total US emissions. Similarly, emissions from aircraft, including domestic flights, international flights and non-commercial flights (lines 61, 62 and 79) came to a total of 209.3 MMT, or roughly 3% of total US emissions.[39]
Global figures
At the global level, finding the figures at this level of detail is ridiculously difficult.[40] Nowhere in the hundreds of charts and tables or in the thousands of pages of numbers and analysis provide by the IPCC will you find a table like the one presented below, so we calculated our own. Without this information, how can anyone be expected to understand what to prioritize when it comes to climate mitigation measures?
We already know that the energy sector accounts globally for 20 GtCO2-eq of emissions. But how much of that is for the generation of electricity and how much for other items that are included within the energy sector?[41] We know the transportation sector accounts for 8.7 GtCO2-eq, but how much of that is from cars and trucks?
Table 3.6 Global Emissions by economic sector and sub-categories[42]
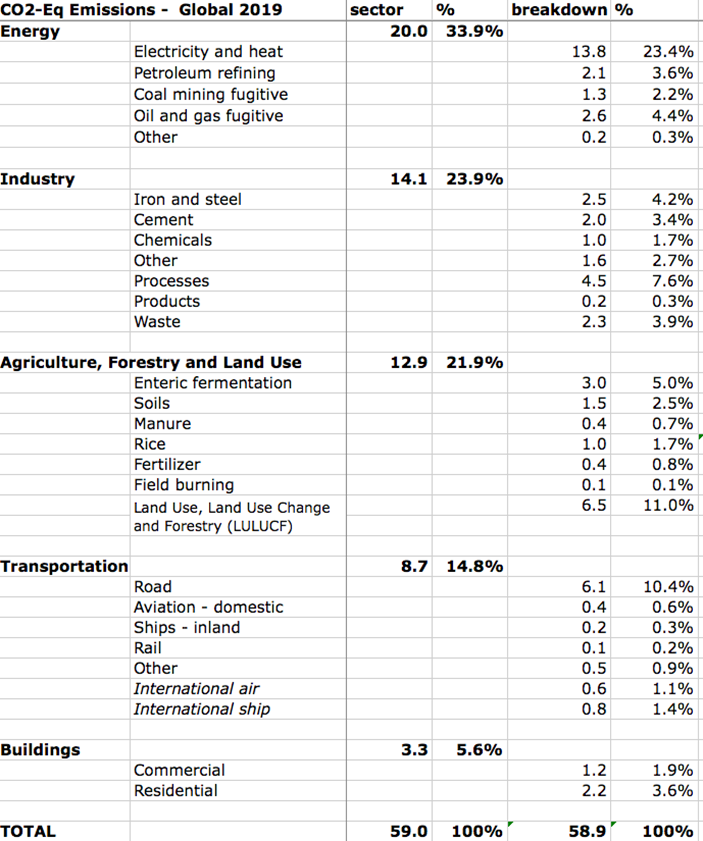
All the figures in the above table come from the IPCC, but nowhere in the thousands of pages of reports from the various IPCC working groups do they present them in a single table like this. And yet these numbers form the essential baseline from which all the other tables and charts derive their figures. So while the numbers presented here must be understood as somewhat tentative, the real numbers must exist somewhere, because the IPCC cannot provide the numbers in the preceding tables without starting from the underlying figures represented in Table 3.6 above.
Net-Zero by 2050
The IPCC published one of their most important reports in 2018, laying out the case for immediate action needed to avoid the most extreme effects of climate change.[43] According to that IPCC report, the world would need to make a 45% cut in global carbon emissions by 2030, reaching a target of net-zero carbon emissions by 2050 to avoid global warming of more than 1.5°C.[44]
Since that IPCC report came out, much has been made of the phrase, “net-zero by 2050,” as if that sums up the goal set by the IPCC to prevent the worst effects of climate change.
But what the IPCC actually said was that to keep global warming to no more than 1.5°C requires a 45% cut in global emissions by 2030. That is a much more immediate and ambitious target than aiming to achieve net-zero by 2050, and without taking the 2030 goal into account, the 2050 goal is actually meaningless.
The problem with carbon dioxide and other greenhouse gases does not have to do with how fast we are pumping them into the air. The problem has to do with how much these gases are staying in the air over time. In other words, it is the accumulation of greenhouse gases in the atmosphere that causes global warming, which is why climate scientists talk about a “carbon budget” that is rapidly being spent as we pour more and more of these gases into the atmosphere.[45]
Climate scientists have calculated that to keep global warming to no more than 1.5°C, the remaining carbon budget of the planet is approximately 500 GtCO2.[46] Since the world is currently adding more than 50 GtCO2 to the atmosphere every single year, that budget is due to run out in less than 10 years. So unless the world begins immediately to make deep cuts in its carbon emissions, we are on track for global warming of much more than 1.5°C, no matter what is eventually achieved by way of emissions by 2050.
In any case, politicians in the US tend to think in terms of what can be achieved in the next two years and very rarely think beyond four years into the future. Setting a goal to be achieved 25-30 years from now is like saying it will be achieved “eventually.” It is so far into the unimaginable future that it can be put on a back burner and forgotten about. Most present-day politicians in the US won’t even be alive by then.
[1] See, for instance, Climate Investigations Center. Global Climate Coalition: Climate Denial Legacy Follows Corporations. (2019, April 25). https://climateinvestigations.org/global-climate-coalition-industry-climate-denial/
[2] See Rojas, D. (2019, September 5). The Climate Denial Machine: How the Fossil Fuel Industry Blocks Climate Action. The Climate Reality Project. https://www.climaterealityproject.org/blog/climate-denial-machine-how-fossil-fuel-industry-blocks-climate-action
[3] With carbon trading, the originating company, country or another entity pays a second company, country or entity for emission “credits,” which allow the originating company to emit more carbon above their allotted quota because the second entity has emitted less than their quota and therefore has excess credits to sell. So while the originating entity is technically “buying” a carbon credit from the second one, in effect they are “selling” their excess carbon emissions to that second entity, who then looks in the carbon book-keeping accounts to be emitting more carbon than they actually are.
[4] DeLuca, A. (2021, September 28). An Update on Our Path to Net Zero. Delta News Hub; Delta Air Lines. https://news.delta.com/update-our-path-net-zero
[5] See Slade, R., et al. (2022). Climate Change 2022: Mitigation of Climate Change. In P. R. Shukla & J. Skea (Eds.), Intergovernmental Panel on Climate Change (p. 66). Working Group III. https://www.ipcc.ch/report/ar6/wg3/
[6] See Crawford, N. (2019). Pentagon Fuel Use, Climate Change, and the Costs of War. In Watson Institute for International and Public Affairs. Brown University. https://watson.brown.edu/costsofwar/files/cow/imce/papers/Pentagon%20Fuel%20Use%2C%20Climate%20Change%20and%20the%20Costs%20of%20War%20Revised%20November%202019%20Crawford.pdf
[7] Amounts measured in GtCO2-eq are used throughout this book to refer to all forms of greenhouse gas emissions converted to their carbon dioxide equivalent following the formula used by the IPCC.
[8] Note that 25.4 MMT (million metric tons) is equal to 0.025 Gt (gigatons). See Belcher, O., Bigger, P., Neimark, B., & Kennelly, C. (2019). Hidden carbon costs of the “everywhere war”: Logistics, geopolitical ecology, and the carbon boot‐print of the US military. Transactions of the Institute of British Geographers, 45(1), 72. https://doi.org/10.1111/tran.12319
[9] Of the top 50 carbon polluters in 2014, the US military ranks number 46, with more CO2 emissions than Romania, Turkmenistan, Greece, Israel or the remaining 145 countries in the world, whose emissions are very small. See ibid, p. 74.
[10] See Slade, R., et al. (2022). Climate Change 2022: Mitigation of Climate Change. In P. R. Shukla & J. Skea (Eds.), Intergovernmental Panel on Climate Change (p. 66). Working Group III. https://www.ipcc.ch/report/ar6/wg3/
[11] Differences due to rounding. Energy sector includes only oil refineries and fugitive emissions, etc. when electricity is covered in other sectors. Transportation is slightly increased because of electrified rail networks. Industry and buildings increase substantially when including the electricity they consume. See Slade, R., et al. (2022). Climate Change 2022: Mitigation of Climate Change. In P. R. Shukla & J. Skea (Eds.), Intergovernmental Panel on Climate Change (p. 237). Working Group III. https://www.ipcc.ch/report/ar6/wg3/
[12] Project Drawdown is one of the most well-known examples of taking the carbon footprint approach. Using this approach, moving to wind-powered and solar-powered electricity are their top two climate solutions, which would also be the case without taking a carbon footprint approach. However, many of their other top-rated climate solutions only rate as highly as they do because of the broader footprint calculation. Eating a plant-rich diet comes third, for instance, and family planning and education are among the top ten. These are solutions that don’t even feature except via a footprint approach. See Project Drawdown. Table of Solutions. (2020, February 5). https://drawdown.org/solutions/table-of-solutions
[13] SUVs are counted in the US as “light trucks” separately from cars, but together they add up to over 1.0 GtCO2 out of US total of 6.6 GTCO2-eq in 2019. See EPA. (2023) Inventory of U.S. Greenhouse Gas Emissions and Sinks 1990-2021. In EPA (pp. 2–36). U.S. Environmental Protection Agency. https://www.epa.gov/system/files/documents/2023-04/US-GHG-Inventory-2023-Main-Text.pdf
[14] Flight Deck Friend. (2017, January 5). How Much Fuel does the Jumbo Jet Burn? https://www.flightdeckfriend.com/ask-a-pilot/how-much-fuel-does-a-jumbo-jet-burn/
[15] Figures for the carbon emissions from commercial aviation vary, but officially domestic aviation accounts for 0.6% of total emissions and international aviation accounts for 1.1%. See table on pg. 32. And for more details, see Lee, D. S., et al. (2020). The contribution of global aviation to anthropogenic climate forcing for 2000 to 2018. Atmospheric Environment, 244(117834). https://doi.org/10.1016/j.atmosenv.2020.117834
[16] Electricity production=23.4%, road vehicles=10.4%, heating=5.6%. See table on pg. 32 in Chapter 3.
[17] EPA. (2020, October). Agriculture and Aquaculture: Food for Thought. U.S. Environmental Protection Agency. https://www.epa.gov/snep/agriculture-and-aquaculture-food-thought
[18] Slade, R., et al. (2022). Climate Change 2022: Mitigation of Climate Change. In P. R. Shukla & J. Skea (Eds.), Intergovernmental Panel on Climate Change (p. 750). Working Group III. https://www.ipcc.ch/report/ar6/wg3/
[19] The Vegan Society. (2021, October 19). Follow the science and Plate Up for the Planet. The Vegan Society. https://www.vegansociety.com/news/news/follow-science-and-plate-planet
[20] These other greenhouse gases are more potent than CO2 in terms of their Global Warming Potential, or GWP. The IPCC provides standardized metrics for calculating the GWP of different gases (over a one-hundred-year period, or GWP100), and these are constantly being updated as the scientific understanding changes or as more pollution in the air changes the actual values. Unfortunately, different countries and different research institutes are using different versions of the GWP metrics, producing different figures for total emissions from these other gases, sometimes even within the same organization. The latest 3 versions are the IPCC’s fourth assessment report (AR4) from 2007, AR5 from 2013, and AR6 from 2021. On the EPA’s own website, they claim to use the most recent GWP values in their reporting, but that the Inventory of U.S. Greenhouse Gas Emissions and Sinks uses AR5 and the Greenhouse Gas Reporting Program uses AR4. And adding to the confusion is the fact that the only place to find the list of the latest AR6 GWP values is on a document that instructs: Do Not Cite, Quote Or Distribute.
[21] IEA. (2022, October 27). International Energy Agency. https://www.iea.org/world
[22] One of the challenges is reporting what is the result of human activity versus what are considered “natural” changes to the land, for instance from wildfires. See UNFCC. (2017). Land Use, Land-Use Change and Forestry (LULUCF) | UNFCCC. United Nations Framework Convention on Climate Change; United Nations. https://unfccc.int/topics/land-use/workstreams/land-use–land-use-change-and-forestry-lulucf
[23] IPCC Working Group I, for example, only reports “directly induced anthropogenic sinks” while leaving indirectly induced sinks within the numbers of the natural carbon cycle. See: Working Group I. (2023). Synthesis report for the technical assessment component of the first global stocktake (p. 12). United Nations Framework Convention on Climate Change. https://unfccc.int/sites/default/files/resource/GST_SR_36a_1.pdf
[24] Differences are due to rounding.
[25] Includes emissions from fossil fuel combustion, including biofuels and waste.
IEA. (2022, October 27). World. International Energy Agency. https://www.iea.org/world
[26] See Crippa, M., et al. (2022). CO2 emissions of all world countries – JRC/IEA/PBL 2022 Report. In EDGAR. Publications Office of the European Union. https://edgar.jrc.ec.europa.eu/report_2022
[27] Includes gas flaring and cement emissions but not biofuels or waste. Climate Watch. (2022). Historical Greenhouse Gas (GHG) Emissions. Climate Watch. https://www.climatewatchdata.org/ghg-emissions?breakBy=gas&end_year=2021§ors=cement&source=GCP&start_year=1960
[28] This is the total figure for 2019 used throughout IPCC AR6 reporting. See AR6 Summary for Policymakers, AR6 Synthesis Report, and AR6 Working Group III Report.
[29] See footnote 20 above.
[30] 2019 is the last year that global figures are available for all types of emissions. Most are also now available for 2020, but because of the global shutdown during COVID, those numbers are an anomaly and do not reflect the ongoing trend, which by all accounts bounced back in 2021 and continued upwards in 2022 and 2023.
[31] These are the total direct emissions per economic sector, as opposed to the figures including electricity discussed above. Slade, R., et al. (2022). Climate Change 2022: Mitigation of Climate Change. In P. R. Shukla & J. Skea (Eds.), Intergovernmental Panel on Climate Change (p. 237). Working Group III. https://www.ipcc.ch/report/ar6/wg3/
[32] US figures here are shown in Gt (gigatons) for comparison with global figures. On the following table they are shown in MMT (million metric tons). 1.65 Gt is equal to 1,650 MMT, etc.
[33] Adding 122 MMT of emissions not officially included in total (line 78) would make total US emissions 6.7 GtCO2-eq for 2019.
[34] EPA. (2023). Inventory of U.S. Greenhouse Gas Emissions and Sinks: 1990-2021. In U.S. Environmental Protection Agency (pp. 2–29, 2–36, 2–37). https://www.epa.gov/ghgemissions/inventory-us-greenhouse-gas-emissions-and-sinks-1990-2021
[35] Note that 9, 11, 12, 20 and 24 would typically be put under the category of “Energy” in IPCC documentation, but this EPA document uses “Industry” for them.
[36] + Does not exceed 0.05 MMT CO2 Eq. or 0.05 percent.
a Percent of total (gross) emissions excluding emissions from LULUCF for 2021.
b Includes CH4 and N2O emissions from fuel combustion.
c The LULUCF Sector Net Total is the net sum of all LULUCF CH4 and N2O emissions to the atmosphere plus LULUCF net carbon stock changes.
Notes: Total gross emissions presented are without LULUCF. Total net emissions are presented with LULUCF. Totals may not sum due to independent rounding. Parentheses indicate negative values or sequestration.
[37] It is worth noting that globally, the number one source of carbon is industry, whereas in the US the number one source is transportation (and within that, passenger cars and SUVs)
[38] Sports Utility Vehicles are larger framed cars.
[39] It is not clear how much of the “other aircraft” is military as opposed to private jets, but as discussed above, we know that much of the military emissions are omitted from these figures.
[40] The figures for the table below were compiled from numbers hidden within 1,200 pages of text of the IPCC’s Working Group III, sometimes appearing only as percentages and at no place listed together as a single table of information.
[41] IPCC energy sector includes “electricity and heat” as one item, because many electric power plants also generate heat for nearby buildings. Other categories within the energy sector are fugitive emissions from oil and gas operations, petroleum refining, fugitive emissions from coal mining, and “other” emissions.
[42] These figures are all from IPCC, AR6 Working Group III Full Report. Transportation emissions are calculated from percentages provided on pg. 237 and 1055 (minus indirect emissions from electric trains), Energy emissions are taken from figures and percentages on pg. 620, Industry emissions are from figures on pg. 1172 and 1173, Agriculture, Forestry and Land Use figures are calculated from percentages on pg. 66, Buildings emissions are taken from percentages on page 963 ff.
[43] IPCC. (2018). Global Warming of 1.5 oC. Intergovernmental Panel on Climate Change. https://www.ipcc.ch/sr15/
[44] Emissions must truly add up to zero and not merely appear that way because of accounting tricks discussed elsewhere in this chapter. See IPCC. (2018). Global Warming of 1.5 oC. Intergovernmental Panel on Climate Change. https://www.ipcc.ch/sr15/
[45] See CarbonTracker.org for a good explanation of carbon budgets: Damon, A. (2020, May 11). Carbon budgets: Where are we now? Carbon Tracker Initiative. https://carbontracker.org/carbon-budgets-where-are-we-now/
[46] Slade, R., et al. (2022). Climate Change 2022: Mitigation of Climate Change. In P. R. Shukla & J. Skea (Eds.), Intergovernmental Panel on Climate Change (p. 46). Working Group III. https://www.ipcc.ch/report/ar6/wg3/