What does the US currently spend on nuclear weapons?
To find this number, we have to add together the direct costs of managing and upgrading existing nuclear weapons, missile defense, legacy costs, threat reduction, expected cost overruns, indirect costs, overhead costs, and final disposal.
It is notoriously difficult to determine exactly how much the US actually spends on nuclear weapons. The government itself does not provide an overall figure. The annual Department of Defense (DOD) budget includes a figure for “Strategic Forces,” but this includes programs that are not nuclear-related and leaves out many that are.[1]
Independent analysts have looked at the figures in more detail over the years, but none very recently, and they all use different methodologies.[2] Here, to try to be consistent, we will stick as far as possible with the estimates provided by the Congressional Budget Office (CBO).
According to the CBO, the baseline figure for nuclear weapons spending by the Department of Defense (DOD) is $34.7 billion for 2023 and $468 billion over the next 10 years.
Table: Nuclear weapons spending – Department of Defense[3]
Several other government departments are also involved in nuclear weapons activities, most notably the Department of Energy (DOE), which is responsible for overseeing (and paying for) most of the research, development and production of nuclear warheads in the US. The CBO shows DOE nuclear weapons-related expenses adding another $17.7 billion for 2023, and another $192 billion over the next ten years.[4]
So far, these figures include the direct costs of managing all the bombs and missiles in silos, submarines, and airplanes, the direct costs of redesigning and developing all the warheads, and the direct costs of running all the command and control, communications, and early warning systems that support these weapons.
Table: Nuclear weapons spending – Department of Energy[5]
Missile defense
According to the CBO itself, these figures do not include the costs associated with defending our own missiles from possible attack.[6] Is “Ballistic Missile Defense” (BMD) intended mainly to try to shoot down nuclear missiles or conventional missiles? It’s unclear. One clue is that BMD is very expensive, which would be hugely disproportionate to the scale of damage conventional missiles might cause. Thus it must be presumed that BMD is mainly focused on the threat of incoming nuclear weapons.[7]
BMD (its current iteration is called the “Missile Defense and Defeat” program) is a direct legacy of Ronald Reagan’s “Star Wars” vision. [8] That vision proved to be the only stumbling block to an agreement with the Soviets to eliminate all nuclear weapons in the 1980s. It’s also a direct legacy of George W. Bush’s unilateral withdrawal from the Anti-Ballistic Missile (ABM) Treaty, from which relations with Russia have never recovered.[9]
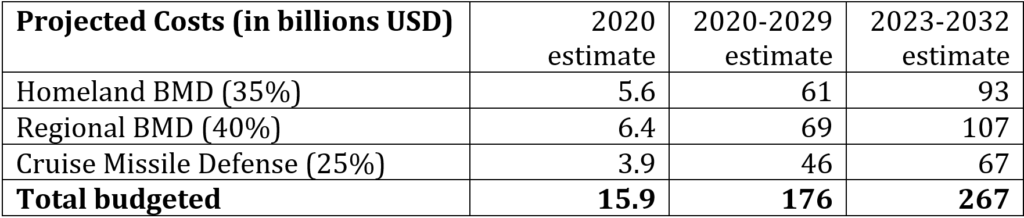
In 2020, the CBO estimated missile defense costs to be $15.9 billion for that year, rising to $20.3 by 2029.[10] However, the budget for Fiscal Year 2021 was already 20.3 billion;[11] in FY 2022 it was 20.4 billion;[12] in FY 2023 it was 24.7 billion;[13], and in FY 2024 it is expected to be 29.8 billion.[14] These numbers may include costs that are not all nuclear weapons-related. Nevertheless, it’s clear that missile defense costs are increasing much faster than anticipated in 2020, perhaps at least in part because of additional costs related to the newly formed Space Force.[15]
Multiply this escalating annual estimate by 10 years, and the total, just for missile defense, would be more like $350 billion.[16] Alternatively, using a more conservative average rate of increase of just $0.4 billion per year (not including inflation), the 10-year figure would come to around $267 billion – less than $350 billion, but more realistic than the $176.4 billion that DOD estimated in 2020.
Table: Missile Defense spending – Department of Defense[17]
Legacy costs and threat reduction
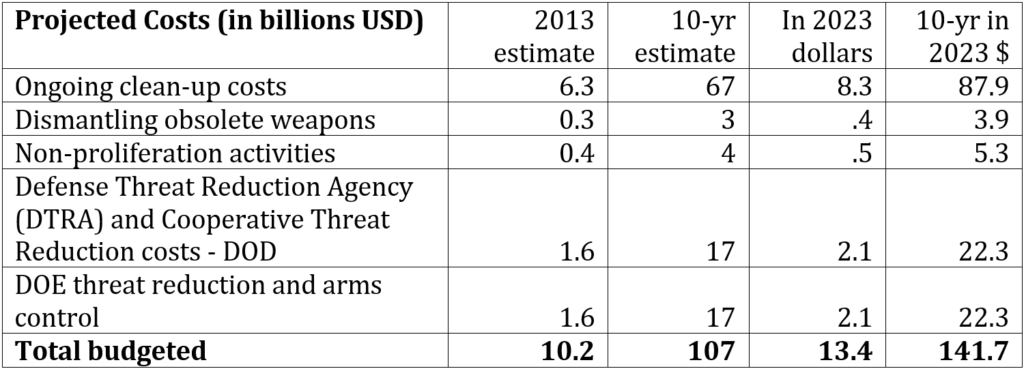
Other nuclear weapons-related costs not included in the CBO’s overall figures include what are referred to as the “legacy costs” of nuclear weapons: dismantling nuclear weapons no longer in use, disposing of the highly radioactive waste, and cleaning up the mess left behind from manufacturing and testing nuclear weapons. CBO figures also do not include what is now called “threat reduction,” or the costs of implementing arms control agreements and programs aimed at reducing the threat of nuclear weapons disappearing from stockpiles or falling into the hands of terrorists.[18]
These additional categories were estimated to cost an additional $10.2 billion in 2014,[19] which was the last time the CBO counted those figures. The CBO estimated the ten-year cost at $108 billion (2014-2023).[20] Because the CBO has not updated these figures since 2013, it is difficult to know what the equivalent costs are today.[21]
If we extrapolate the figures from 2013, using the US Bureau of Labor Statistics’ official inflation calculator, these numbers in 2023 dollars would amount to $13.4 billion per year and $141.7 billion in 2023 dollars for the 10 years to 2032.[22] We do not know what the true figures are, but this category adds at least $100 billion more in nuclear weapons-related costs over the next 10 years. The true figure is probably closer to $150 billion.
Table: Legacy and Threat Reduction spending[23]
Expected cost overruns
Based on an analysis of historical cost overruns that are endemic to the defense industry, the CBO has calculated figures for what they anticipate these to be for various defense programs going forward.
Table: Nuclear Weapons Cost Overruns from CBO reports 2015-2023[24]
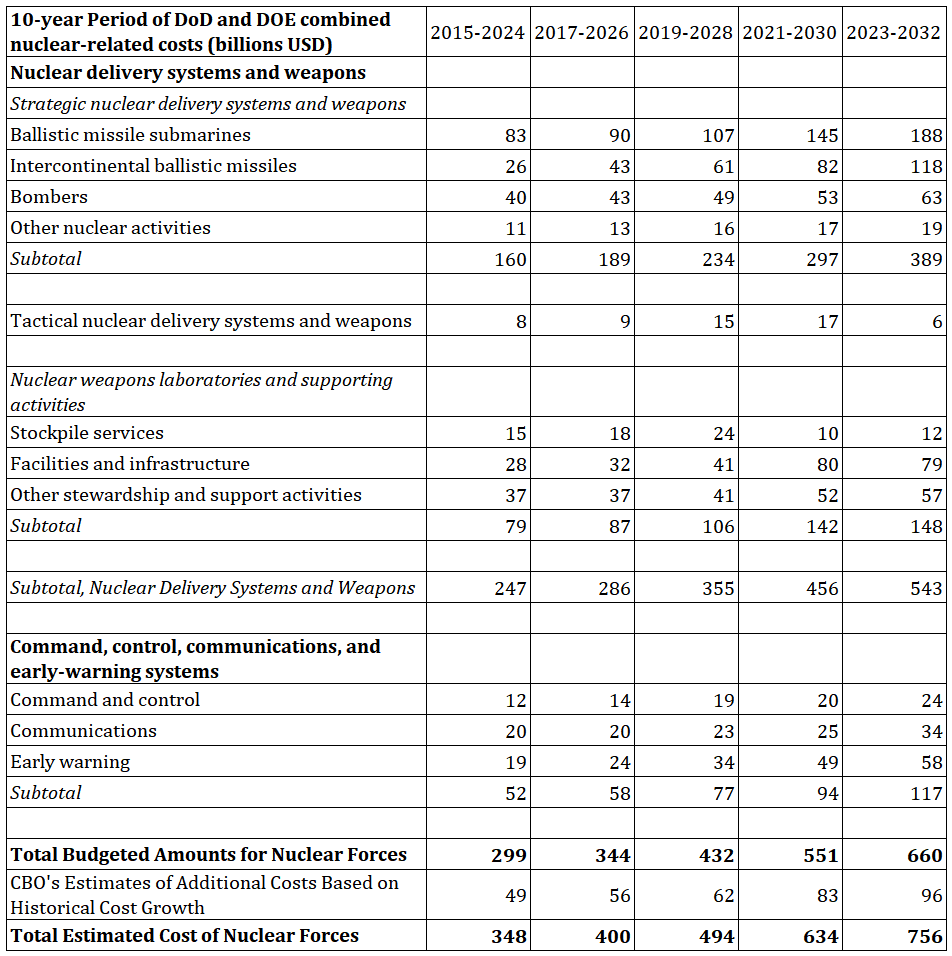
As you can see in this table, CBO estimates for nuclear weapons costs have increased each time they have made those estimates. CBO estimates for “additional costs based on historical cost growth” (second to bottom line) have roughly doubled during the 5 two-year periods since 2015, as have the “total budgeted amounts” (third line from the bottom) and the “total estimated cost” for the next 10 years, which include those estimated overruns (bottom line).
We can therefore safely assume that their estimate of roughly $100 billion is a reasonable amount to add to the 10-year estimates for 2023-2032 coming from the DOD and DOE at the present time. This averages out to roughly $10 billion in additional costs per year on top of the existing estimates.
Table: Estimated Cost Overruns in the 2023 CBO report[25]
| $billions | Per year | 10 years |
| 2023 Estimated DOD overruns | 5.6 | 56 |
| Estimated DOE overrun | 4.0 | 40 |
| Total estimated overruns | 9.6 | 96 |
Indirect and Overhead costs
The CBO figures also do not include any of the overhead costs that the deployment of nuclear weapons incurs out of the total military budget.[26] For every 338 sailors on a ballistic missile submarine, for example, there are another 77 service personnel directly employed to provide them with all the things they need, plus another 251 staff in administrative and other supporting roles.[27]
According to the CBO’s own calculations elsewhere,[28] these additional overhead costs amount to about $5 billion on top of the direct costs.[29] Given the total Pentagon budget, which is fast approaching $1 trillion per year, this is almost certainly an underestimate of the actual costs of supporting the nuclear mission coming from the rest of the military budget.
Table: Calculating indirect and overhead costs of nuclear weapons[30]
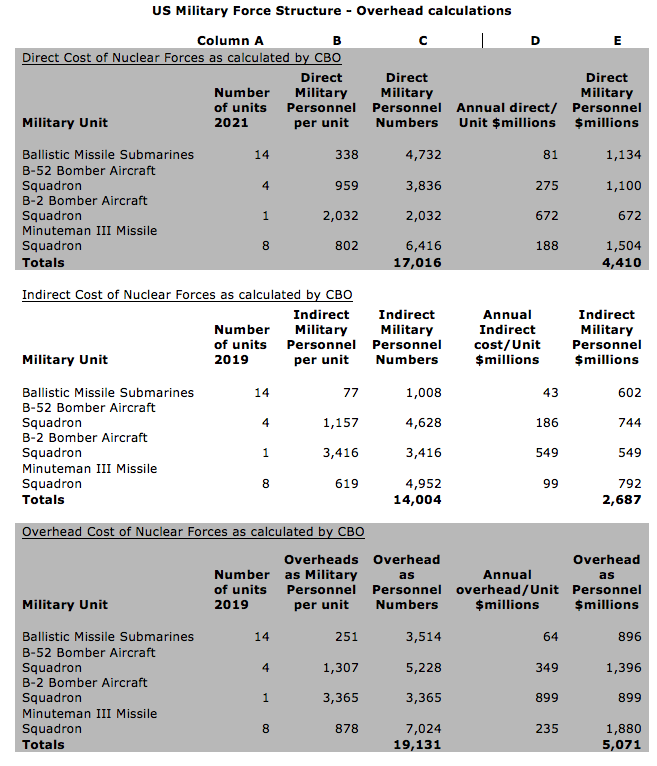
Table: Indirect and overhead costs associated with nuclear weapons[31]
| $billions | Per year[32] | 10 years |
| DoD Overheads not included in nuclear costs | 5.0 | 50 |
Final disposal
Sooner or later, once all the bombs and submarines and nuclear weapons facilities are dismantled and cleaned up, the US has to pay for disposal of the high-level waste that remains. The Atomic Audit calculated in 1996 that this would eventually come to a total cost of $365 billion.[33] That’s close to the amount of money the government had set aside by 2017 to cover this eventual expense, but by 2019 the figure was $494 billion, and as of 2022, this figure was $520 billion.[34]
That is the estimate for final disposal of the nation’s high-level radioactive waste over the next 50 years – including that from nuclear power plants[35] as well as nuclear weapons (see chapter 4). If these future costs of $520 billion over the next 50 years were to be accounted for on an annual basis, that would add another $10.4 billion per year to the total cost of nuclear weapons in the US, and another $104 billion over 10 years.
Table Estimated Final Disposal costs
| $billions | Per year[36] | 10 years |
| Total 50 year liability of $520 billion | 10.4 | 104 |
Adding it all together
Adding together all of the above brings us to a total cost of over $110 billion for US nuclear weapons in 2023. This figure is based on data largely from the CBO, albeit coming from a variety of different CBO reports over different time periods. Those same reports add up to a cumulative figure of roughly $1.3 trillion for nuclear weapons over the next 10 years.
Table: Adding up nuclear weapons costs
| In current $billions | 2023 | 2023-2032 10-yr projection |
| DOD nuclear weapons costs | 34.7 | 468 |
| DOE nuclear weapons costs | 17.7 | 192 |
| Missile defense | 24.7 | 267 |
| Legacy and threat reduction | 13.4 | 142 |
| Expected cost overruns | 9.6 | 96 |
| Overheads | 5.0 | 50 |
| Liability for final disposal | 10.4 | 104 |
| Total | 115.5 | 1,319 |
Nuclear weapons plans over the next 30 years
In 2017, the CBO estimated the total cost of nuclear weapons over the next 30 years of so-called nuclear “modernization” would be $1.2 trillion in constant 2017 US dollars (USD).[37] As you can see above, the true cost of nuclear weapons programs already comes to more than that just for the next ten years. So what is a realistic estimate for the cost of maintaining nuclear weapons over the next thirty?
The 2017 estimate assumed costs would rise from $29 billion in 2017 to $47 billion in 2026 before peaking at $50 billion a year through early 2030s. In the 2040s, annual costs will be around $30 billion. Specific numbers per year from 2017-2046 are provided in the table of data underlying the figures.
Once again, however, the numbers are already well above what was being predicted in 2017, since the current nuclear weapons budget for 2023, using the same categories as used in this report (i.e. only DOD and DOE costs) is already $52.4 billion, well above the peak of $50 billion that was expected to be reached by 2030.
Figure: Expected costs of nuclear modernization spread over 50 years[38]
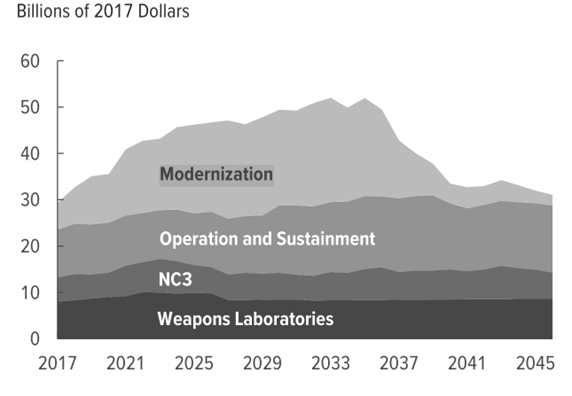
Clearly, the nuclear weapons modernization program does not end in 2030 or 2032, but will continue with annually increasing budgets at least until the mid-2030s that are not expected to return to “baseline” levels until around 2050. Looking ahead 30 years rather than 10, therefore, we can expect the cumulative cost of nuclear weapons to continue to rise to astronomical heights by 2050. Even if the cumulative costs rise at a slower rate from, say, 2035 onwards, they are still rising. And if the 2017 figures based on constant 2017 dollars are adjusted to constant 2023 dollars, we would get a cumulative figure of roughly $1.5 trillion.
Adjustments for inflation
In calculating future costs, the CBO often uses “constant” year dollars, in this case constant 2017 dollars.[39] This means that the “nominal” or real cost[40] will be higher if we follow the standard assumption that inflation will continue to increase. Future inflation rates are impossible to know and can only be estimated, but the choice to use constant 2017 dollars gives us a lower value than what the real cost to taxpayers will be.
In 2017, accounting for inflation, the CBO estimated that the 30-year total would come to 1.7 trillion USD in unadjusted dollars.[41] That figure would now come to well over $2 trillion.[42]
Atomic audit
The most comprehensive analysis of the true cost of nuclear weapons was conducted by the Brookings Institution in 1996. The 722-page report detailed every aspect of the nuclear program, from the first beginnings of the Manhattan Project to the dismantling of more than 25,000 obsolete nuclear weapons by 1996.
The Atomic Audit calculated that the US had spent more than $5.5 trillion (in 1996 dollars) on its nuclear weapons program between 1940 and 1996.[43] This amounted to 29% of total military spending during that period. They calculated that another $365 billion would still be needed for final disposal of the plutonium and other highly radioactive waste produced during that period.
Table 14.16 Atomic Audit[44]
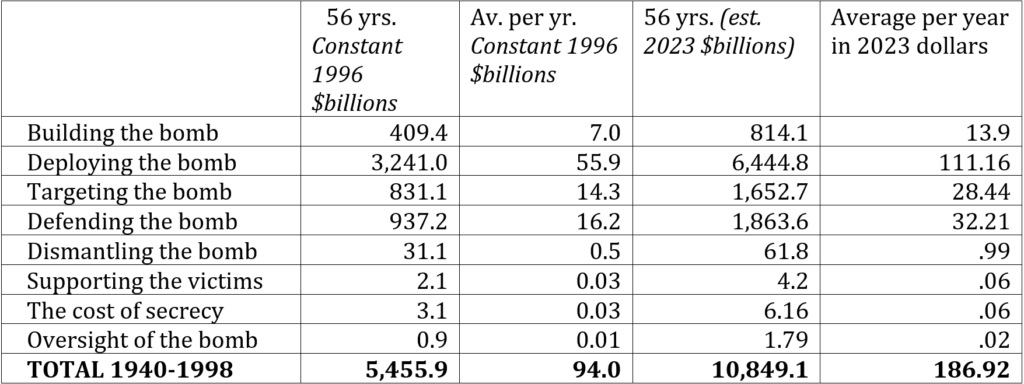
Updating these figures from 1996 dollars to 2023 dollars almost doubles the total cost to just over $10.8 trillion. And averaging that over a period of 56 years comes to nearly $200 billion per year (see table above). So even our estimate of $110 billion or more per year based on CBO figures could be underestimating the real cost by as much as half.
Unlike the money spent on renewable energy, this is not a capital investment in things that will bring a return of income at a later date. This money is simply spent and then it is gone. It is turned into weapons that can never even be used except in an end-of-the-world scenario.
[1] See summary of what is and is not included in the DoD Strategic Forces budget in, Harrison, T., & Montgomery, E. B. (2015). The Cost of U.S. Nuclear Forces from BCA to Bow Wave and Beyond. In CSBA (p. 8). Center for Strategic and Budgetary Assessments. https://csbaonline.org/uploads/documents/CSBA-NCS_Resize_FINAL_WEB.pdf
[2] See, for instance, Harrison, CSBA (2015) op.cit., Schwartz, S. I., & Choubey, D. (2009). Nuclear Security Spending: Assessing Costs, Examining Priorities. Carnegie Endowment for International Peace. https://carnegieendowment.org/2009/01/12/nuclear-security-spending-assessing-costs-examining-priorities-pub-22601, Cohn, N., & Rumbaugh, R. (2012). Resolving Ambiguity: Costing Nuclear Weapons. The Henry L. Stimson Center. https://www.stimson.org/2012/resolving-ambiguity-costing-nuclear-weapons/, Ploughshares Fund. (2011). What Nuclear Weapons Cost Us. https://ploughshares.org/sites/default/files/resources/What%20Nuclear%20Weapons%20Cost%20Us-3.pdf, and Wolfsthal, J. B., Lewis, J., & Quint, M. (2014). The Trillion Dollar Nuclear Triad. In Nonproliferation.org. James Martin Center for Nonproliferation Studies. https://nonproliferation.org/wp-content/uploads/2016/04/140107_trillion_dollar_nuclear_triad.pdf
[3] Congressional Budget Office. (2023). Projected Costs of U.S. Nuclear Forces, 2023 to 2032. CBO. (p. 3). https://www.cbo.gov/publication/59054
[4] CBO figures do not include a number of ‘nuclear weapons-related costs’ or any ‘overhead and support’ costs connected with nuclear weapons. See explanation in Congressional Budget Office. (2019). Projected Costs of U.S. Nuclear Forces, 2019 to 2028 (p. 5). CBO. https://www.cbo.gov/publication/54914
[5] Congressional Budget Office. (2023). Projected Costs of U.S. Nuclear Forces, 2023 to 2032. CBO. (p. 3). https://www.cbo.gov/publication/59054
[6] “Besides the costs directly attributable to fielding nuclear forces, some published estimates of the total costs of nuclear weapons account for the costs of several related activities…[including] the costs of developing and maintaining active defenses against other countries’ nuclear weapons (primarily ballistic missiles). CBO has not updated its estimate of those costs, which was published in 2013, and such costs are not included in this report.” Congressional Budget Office. (2019). Projected Costs of U.S. Nuclear Forces, 2019 to 2028 (p. 5). CBO. https://www.cbo.gov/publication/54914
[7] While “ballistic missiles,” a category including non-nuclear armed warheads, is the most common term used in missile defense discussions, the origin and development of programs such as Ground-Based Midcourse Defense have been explicitly described as defense against nuclear weapons and nuclear states. https://www.brookings.edu/articles/the-limits-of-u-s-missile-defense/
[8] Congressional Budget Office. (2021). Costs of Implementing Recommendations of the 2019 Missile Defense Review. CBO. (p.5) https://www.cbo.gov/publication/56960
[9]Acton, J. M. (2021, December 13). The U.S. exit from the Anti-Ballistic Missile Treaty has fueled a new arms race. Carnegie Endowment for International Peace. https://carnegieendowment.org/2021/12/13/u.s.-exit-from-anti-ballistic-missile-treaty-has-fueled-new-arms-race-pub-85977,
Farabaugh, B., & Holmes, D. (2019, June 27). Did abandoning the ABM Treaty make America safer? Center for Arms Control and Non-Proliferation. https://armscontrolcenter.org/did-abandoning-the-abm-treaty-make-america-safer/,
Kim, L. (2020, December 9). Arms Control: When Biden Takes Office, Clock Will Be Ticking To Save New START Treaty. NPR. https://www.npr.org/2020/12/09/943869767/arms-control-when-biden-takes-office-clock-will-be-ticking-to-save-new-start-tre,
Kuchins, A. C. (2016, September 23). That brief U.S.-Russia strategic partnership 15 years ago? New interviews reveal why it derailed. Washington Post. https://www.washingtonpost.com/news/monkey-cage/wp/2016/09/23/that-brief-u-s-russia-strategic-partnership-15-years-ago-new-interviews-reveal-why-it-derailed/
[10] Congressional Budget Office. (2021). Costs of Implementing Recommendations of the 2019 Missile Defense Review. CBO. (Figure 1 in supplementary tables). https://www.cbo.gov/publication/56960
[11] U.S. Department of Defense. (2020). Program Acquisition Cost By Weapon System. In U.S. Department of Defense (B-5152D55). https://comptroller.defense.gov/Portals/45/Documents/defbudget/fy2021/fy2021_Weapons.pdf
[12] The Department of Defense Releases the President’s Fiscal Year 2022 Defense Budget. (n.d.). U.S. Department of Defense. https://www.defense.gov/News/Releases/Release/Article/2638711/the-department-of-defense-releases-the-presidents-fiscal-year-2022-defense-budg/
[13] Office of the Undersecretary of Defense, Defense Budget Overview 2023, p. 10. https://comptroller.defense.gov/Portals/45/Documents/defbudget/FY2023/FY2023_Budget_Request.pdf
[14] U.S. Department of Defense. (2020). Program Acquisition Cost By Weapon System. In U.S. Department of Defense (B-5152D55). https://comptroller.defense.gov/Portals/45/Documents/defbudget/fy2021/fy2021_Weapons.pdf
[15] Congressional Budget Office. (2021). Costs of Implementing Recommendations of the 2019 Missile Defense Review. CBO. (p. 10ff.). https://www.cbo.gov/publication/56960
[16] Back in 2020, DOD estimated its missile defenses to be $176.4 billion for the period 2020-2029. That included $61 billion for homeland BMD, $69 billion for regional BMD, and $46 billion for cruise (and hypersonic) missile defense. If these figures were updated with the 2023 figure of $24.9 billion as a baseline (instead of the $15.9 billion from 2020), and were to increase at the same average rate of $2.25 billion per year, the 10-year figure would be $350 billion. Congressional Budget Office. (2021). Costs of Implementing Recommendations of the 2019 Missile Defense Review. CBO. (p. 1). https://www.cbo.gov/publication/56960
[17] Figures for 2020 are based on percentages provided on page 13 of the total figure listed for 2020. Congressional Budget Office. (2021). Costs of Implementing Recommendations of the 2019 Missile Defense Review. CBO. (p. 1). https://www.cbo.gov/publication/56960.
2023- 2032 Estimate using a baseline figure of $29.4 billion for 2023 and increasing this each year by just $0.4 billion to 2032, assuming the same percentages for each sub-program as listed.
[18] “Besides the costs directly attributable to fielding nuclear forces, some published estimates of the total costs of nuclear weapons account for the costs of several related activities. Examples include the costs of addressing the nuclear legacy of the Cold War (such as dismantling retired nuclear weapons and cleaning up environmental contamination from past activities at nuclear facilities); the costs of reducing the threat from other countries’ nuclear weapons (including U.S. efforts to halt proliferation, comply with arms control treaties, and verify other countries’ compliance with treaties). CBO has not updated its estimate of those costs, which was published in 2013, and such costs are not included in this report.” Congressional Budget Office. (2019). Projected Costs of U.S. Nuclear Forces, 2019 to 2028 (p. 5). CBO. https://www.cbo.gov/publication/54914
[19] Congressional Budget Office. (2013). Projected Costs of U.S. Nuclear Forces, 2014 to 2023. CBO. (p. 7). https://www.cbo.gov/publication/44968
[20] Congressional Budget Office. (2013). Projected Costs of U.S. Nuclear Forces, 2014 to 2023. CBO. (p7). https://www.cbo.gov/publication/44968
[21] According to the FY 2023 Office of Environmental Management budget request, $7.64 billion was requested for nuclear weapons clean up costs alone in 2023. See Office of Environmental Management. (2022, March 29). FY23 budget request sets stage for continued EM success. Energy.gov. https://www.energy.gov/em/articles/fy23-budget-request-sets-stage-continued-em-success. Other non-proliferation activities appear to be included in other budgets, while the comparative costs of threat reduction programs is difficult to ascertain because of changing definitions and budget lines. The 2023 budget for the Defense Threat Reduction Agency was $0.9 billion, which may or may not include other threat reduction activities. DoD’s costs in the threat reduction category support some of the activities of the Defense Threat Reduction Agency, the Cooperative Threat Reduction program for securing nuclear weapons and materials in other countries, on-site inspections by the military services and other activities to implement arms control agreements, and various programs that conduct research to better understand nuclear threats from other countries. DOE’s costs (which will all be paid under the appropriation title for defense nuclear non-proliferation) support research related to the non-proliferation of arms and technologies to verify arms control, the Global Threat Reduction Initiative (a program for securing nuclear materials worldwide), and other activities.
[22] Calculated using the inflation calculator from U.S. Bureau of Labor Statistics assuming January 2014 for 2014 USD, with 2023 USD calculated as of August 2023. U.S. Bureau of Labor Statistics. (n.d.). CPI Inflation Calculator. https://www.bls.gov/data/inflation_calculator.htm
[23] Congressional Budget Office. (2013). Projected Costs of U.S. Nuclear Forces, 2014 to 2023. CBO. (p7). https://www.cbo.gov/publication/44968
2023 dollars calculated using the inflation calculator from U.S. Bureau of Labor Statistics assuming January 2014 for 2014 USD, with 2023 USD calculated as of August 2023. U.S. Bureau of Labor Statistics. (n.d.). CPI Inflation Calculator. https://www.bls.gov/data/inflation_calculator.htm
[24] Source: Congressional Budget Office. Projected Costs of U.S. Nuclear Forces, 2015; 2017; 2019; 2021, 2023.
[25] Congressional Budget Office. (2023). Projected Costs of U.S. Nuclear Forces, 2023 to 2032. CBO. (p. 3). https://www.cbo.gov/publication/59054
CBO estimates on overrun are only given in a ten year period – here we divide the ten year estimate by 10 to get a rough estimate for 2023.
[26] “CBO’s estimate … does not include a prorated share of the military services’ and DoD’s overhead and support costs that are not specific to the nuclear mission.” Congressional Budget Office. (2023). Projected Costs of U.S. Nuclear Forces, 2023 to 2032. CBO. (p. 7). https://www.cbo.gov/publication/59054
[27] These figures are compiled from the Supplementary Tables in the CBO’s 2022 report The U.S. Military’s Force Structure: A Primer. The tables provide detailed figures for the number and cost of military personnel in each ‘unit’ of the armed forces, including the support personnel and ‘overheads’ that are allocated to that unit. They are accessible from Data Underlying Appendix Tables (Tables A-1, B-1 and B-2), Congressional Budget Office. CBO’s Interactive Force Structure Tool: https://www.cbo.gov/force-structure-tool
[28] See above from Tables A-1, B-1 and B-2.
[29] See Appendix 5: Calculation of nuclear weapon overhead costs. CBO counts only ‘direct’ costs, not ‘indirect’ or ‘overhead’ costs associated with nuclear weapons. See Congressional Budget Office. (2019). Projected Costs of U.S. Nuclear Forces, 2019 to 2028 (p. 5). CBO. https://www.cbo.gov/publication/54914
[30] These figures are all from Tables A-1, B-2 and B-2 in the CBO’s Supplementary Tables from CBO’s Interactive Force Structure Tool. https://www.cbo.gov/publication/54351
[31] Congressional Budget Office. (2023). Projected Costs of U.S. Nuclear Forces, 2023 to 2032. CBO. (p. 3). https://www.cbo.gov/publication/59054
[32] CBO estimates on overrun are only given in a ten year period – here we divide the ten year estimate by 10 to get a rough estimate for 2023.
[33] Schwartz (1998), op.cit.
[34] United States Government Accountability Office. (2023). DOE Nuclear Cleanup. In GAO (GAO-23-106081). (p. 1). https://www.gao.gov/assets/830/828769.pdf
[35]The “low-level” waste from nuclear plants is not included in this estimate. United States Government Accountability Office. (2019). Department of Energy: Program-Wide Strategy and Better Reporting Needed to Address Growing Environmental Cleanup Liability. GAO. https://www.gao.gov/assets/700/696632.pdf
[36] CBO estimates on overrun are only given in a ten year period – here we divide the ten year estimate by 10 to get a rough estimate for 2023.
[37] Congressional Budget Office. (2017, October 31). Approaches for Managing the Costs of U.S. Nuclear Forces, 2017 to 2046. CBO. https://www.cbo.gov/publication/53211
[38] Congressional Budget Office. (2017, October 31). Approaches for Managing the Costs of U.S. Nuclear Forces, 2017 to 2046. (p. 3). CBO. https://www.cbo.gov/publication/53211
[39] Congressional Budget Office. (2017, October 31). Approaches for Managing the Costs of U.S. Nuclear Forces, 2017 to 2046. CBO. (p. 5). https://www.cbo.gov/publication/53211
[40] This is in contrast to real versus nominal wages: the nominal wage is what one is paid, while the real wage is typically a lower value due to inflation.
[41] When the CBO calculates future costs, they “adjust” for inflation to show what the costs would look like in current dollars rather than in future (inflated) dollars. So “unadjusted” figures are the more realistic figures of what costs will actually look like in future years, assuming an average rate of inflation. Reif, K. (2017, December). CBO: Nuclear arsenal to cost $1.2 trillion. Arms Control Association. https://www.armscontrol.org/act/2017-12/news/cbo-nuclear-arsenal-cost-12-trillion
[42] Email communication with Daryl Kimball of the Arms Control Association, Oct. 17, 2023. Given our estimate of $1.35 trillion for the next 10 years, and assuming an ongoing cost of maintaining nuclear weapons at just $30 billion a year for the subsequent 20 years would add a further $600 billion, bringing the total to $1.95 trillion.
[43] Schwartz, S. I. (1998). Atomic audit: The Costs and Consequences of U.S. Nuclear Weapons Since 1940. Brookings Intitution Press.
[44] 2023 $ calculated using the inflation calculator from U.S. Bureau of Labor Statistics assuming January 1996 for the constant 1996 USD and August 2023 for 2023 USD. U.S. Bureau of Labor Statistics. (n.d.). CPI Inflation Calculator. https://www.bls.gov/data/inflation_calculator.htm