Jump to: electricity ~ transportation ~ heating ~ afforestation
The transition to a clean, green economy will cost money. The cost of not making this transition, however, is the collapse of the entire global economy. So the world has to find the money to do this, and it’s not as difficult as it sounds. When money is suddenly needed for war, for a COVID emergency, or even to line the pockets of wealthier taxpayers, somehow the money is available. How much are we spending on nuclear weapons? How much would truly effective climate solutions cost? Can we move the money from one to the other? Can we “feed two birds with one scone?” How much will a green economy cost?
Economic benefits of a green economy
A 2018 report from the Global Commission on the Economy and Climate claimed that “bold action” to address the climate crisis could yield direct economic benefits worth $26 trillion globally over the next 10 years.[1] In any case, it’s clearly beneficial to increase jobs, cut pollution-related health problems, improve access to jobs and housing, reduce waste, increase productivity, and generate government revenues.
There are also costs associated with not adequately re-tooling to a renewable economy and facing the damages of uncontrolled climate disruption. Extreme weather just in the US caused more than $400 billion worth of damage in 2017 and 2018 alone.[2] Worldwide, the UN estimates the total cost of climate change could reach $69 trillion by the end of this century.[3]
Transition is not, however, “free”
US Representative Alexandria Ocasio-Cortez has pointed out that when somebody launches a war, nobody asks “How much is this going to cost?” They just go to war and pay for it later.[4] The same could be said of trillion-dollar tax cuts. But we know that those decisions do cost money. We all pay for it later, in the form of interest on the national debt – in the US, that debt figure is now a staggering $33 trillion.[5]
So, yes, the government can always just borrow more money to pay for a green transition, like they pay for everything else. But there is still a cost.
How much? That’s hotly debated. It will not be free. But it will probably be worth it, and it’s getting cheaper.
Great news—rapidly falling prices for renewables
The accepted way to compare electricity costs is to look at the levelized cost of electricity (LCOE – see Chapter 4): the total costs of building and running a power plant divided by the total amount of electricity produced during its lifetime equals the cost per kWh of electricity.[6]
Just within the last few years, the LCOE for on-shore wind farms and utility-scale solar farms has fallen below the LCOE for coal, gas or nuclear power.[7] In other words, it’s now more profitable for existing utility companies to invest in renewable electricity sources than to invest in more fossil fuel or nuclear power plants. That alone could mean the end of fossil fuels for electricity, though not necessarily in the timescale required.
Everything that has ever been written about the cost of renewable electricity has been out of date by the time it was published. Every year, technological developments and economies of scale are driving these costs further and further down.
Cost vs investment
The cost of transitioning to a green economy is not a “cost” in the same way that paying for nuclear weapons is a “cost.” Paying for green technologies is an investment, since it is creating jobs, bolstering the economy, and ultimately making the cost of doing business cheaper for everyone. It will also bring a return, not simply in the form of taxes as more people are put to work, but also in the form of payments for the services being delivered.
It might, for example, cost $680 billion dollars to build a high-speed rail system, but once the system is built, people will be paying fares to use it, and sooner or later, in a purely “free market” system, those fares would be expected to fully recover the cost of building the system (and then, with much lower ongoing “marginal” costs, it would start to return a net profit). Likewise, income from solar or wind-generated electricity can be expected to far exceed the cost of building windmills and installing solar panels.
Public vs. private investment
In the US, at least, it’s likely that federal, state and local governments would make some of the capital investments necessary for transition to a green economy. But private investors would likely cover two-thirds to three-quarters of the total.[8] The economist Robert Pollin assumes a 50/50 split,[9] while Goldman-Sachs and others base their assumptions on 90% private financing to 10% public.[10]
Those numbers mainly result from calculating how much profit can be made (“return on investment,” or ROI). Since solar and wind are already cheaper than fossil fuels or nuclear power at this stage, and therefore more profitable, it’s not difficult to imagine large amounts of private capital going into utility-scale wind and solar farms.
But distributed (rooftop) solar panels and small-scale wind turbines are less profitable and thus less likely to attract private capital. Selling EVs and heat pumps is also profitable, but if it is not more profitable than selling their fossil fuel equivalents, there is little incentive for private investment.
A Climate Justice approach
To make the transition to a green economy possible for lower income families and communities, especially in poorer countries, there must be government subsidies and interest-free loans to offset the initial outlays for solar and wind, even if in the long run these are paid back through electricity bills.
In the US in 2021, half (65.6 million) of the 131.2 million households in the US in 2021were earning less than the median income of $70,784 per year.[11] Here’s one suggestion to fairly cover the costs of the transition: a sliding scale according to individual households’ income. Such a plan might budget for half the population to make the transition. The very lowest income bracket would pay nothing, while the top income bracket would cover the full costs themselves. In the middle, people would pay some of the costs and get subsidized for the rest.
Electricity
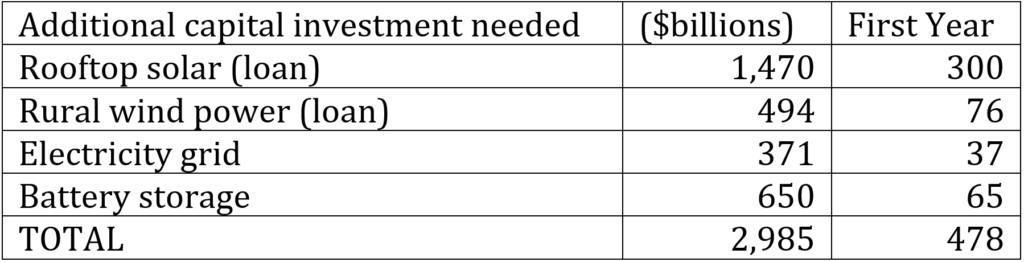
Stanford professor Mark Z. Jacobson estimates that the world currently spends about $11 trillion per year on electricity, mainly from fossil fuels, but that if the world switched entirely to wind, water and sun, the world would only spend $6.6 trillion per year – a cost reduction of over 60%.[1] He estimates that about $61.5 trillion of capital investment would be required globally to complete this transition, including around $6.7 trillion to cover the transition in the United States.[2]
Others have come up with other figures. University of Massachusetts professor Robert Pollin calculates the total global cost of the transition to be more like $120 trillion, or nearly double Jacobson’s figure, but that includes a number of costs other than moving to renewable electricity. [3]
There are many variables involved in these calculations, including assumptions about growth of GDP and other cost factors for the entire globe over a 30-year period.[4] Discrepancies in the estimates are therefore inevitable.
Regardless of the cost, electric utility companies will find that money and pay for the transition, no matter what it costs, if they want to stay in business in a post-fossil fuel world.
What really matters, from a climate justice perspective, is that a) the world agrees to phase out the burning of fossil fuels within the timescale required; and that b) the costs of the transition do not fall unfairly on those who can least afford them.
Table: Capital investment needed in electricity generation
Subsidizing rooftop solar
The number one priority when it comes to electrification is to enable every household to produce their own electricity with rooftop solar panels. How much electricity per household, and what would it cost? The short answer is an average of about 15 kWh, and it could pay for itself (and then some) in the long run.
Consumption and available sunlight vary, but according to the EIA,[1] the “average” US household consumes about 10.6 MWh per year. This could increase by as much as 50% due to charging electric vehicles and increased electrification of heating and cooking, so let’s say the average will be 15 MWh per year.
Though costs vary by state and by company, the average installation is about $30,000. But the IRA currently provides a 30% tax credit on rooftop solar installations, so subtract $10,000. Meanwhile, some states have additional incentives including 0% loans.
Some states also offer connections to community solar programs, leasing of the panels at a fixed or variable rate, etc. However, to produce the most solar power at the best price for the average household, the ideal arrangement is to install wholly owned solar panels with 0% financing and a payback schedule that is monthly the same, or preferably less than, what would otherwise be paid as the electricity bill.
These solar panels are effectively “free” to the owner, because they continue to pay roughly the same amount in loan repayment as they would have been paying in an electricity bill. And if the loan is paid off after 10 years, those people would then be getting literally free electricity, coming straight off their roof for at least another 10 years (depending on the life of the solar panels, generally 20-25 years) before starting the process all over again.
If loans were offered to all households earning below the median wage (i.e. 65.6 million households) while leaving the higher income households to fend for themselves, that would mean a potential cost to the nation of $30,000 x 65.6 million, or a total of $1.965 trillion. All of that money would be paid back over time in the form of loan repayments disguised as electricity bills. And since it would be impossible to install 65.6 million solar installations all at once, the money available to loan in the second year could already be coming from repayments from the first year, and so on down the line. Therefore, the actual capital layout would look more like this:
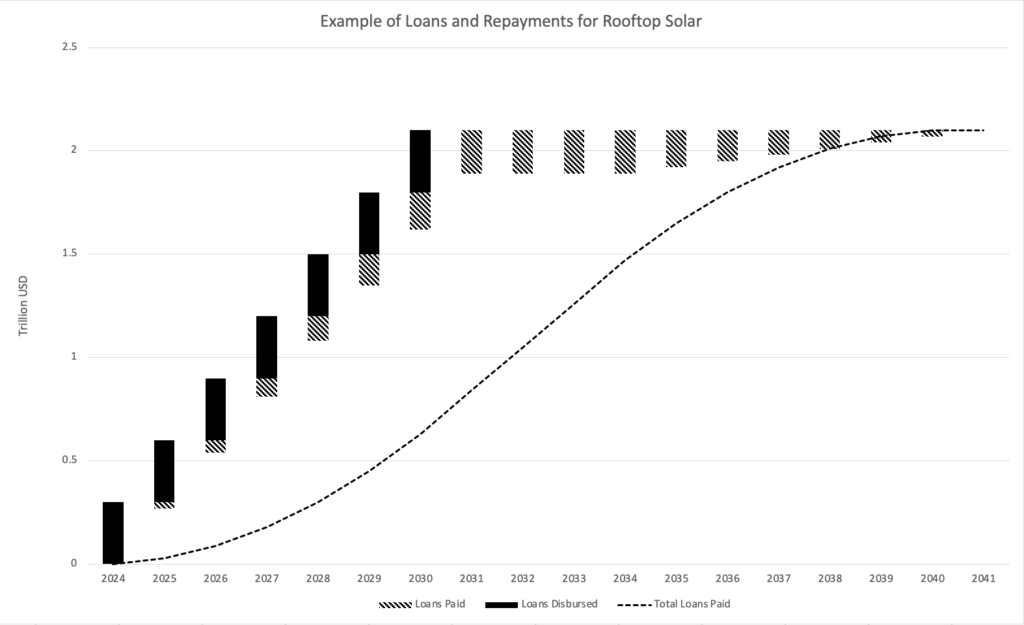
In this example, solar panels are installed for 10 million households per year, and these are paid off over a period of 10 years, starting in 2024. In year one, the outlay would be $300 billion for the first 10 million households. In year two, the outlay would be $270 billion because $30 billion would be repaid from the original $300 billion. In year three, the outlay would be $240 billion because $30 billion more would come from the second year of repayments from the first 10 million households plus another $30 billion from the first year of repayments from the second 10 million households, and so on.
By 2030, all 65 million lower income households in the US would have been fitted with solar panels and the total outlay that year would only be $120 billion. The total loaned out by then would have been $1.47 trillion,[3] but by 2040, all of that would have been repaid back into government coffers. The net cost to the taxpayer: zero dollars.
[1] U.S. Energy Information Administration. (2023, September 13). How much electricity does an American home use? https://www.eia.gov/tools/faqs/faq.php?id=97&t=3
[2] Graphic by Asher Supernaw (2023).
[3] $1.4 trillion is more or less the same figure used by Pollin and Jacobson for the cost of building up solar capacity in the US, even though they come to this figure through quite different means.
Distributed wind
Although rooftop solar is a viable option for many larger buildings, small-scale wind turbines are a more efficient option for many locations. A similar program could provide loans for wind turbine installation on farms, schoolyards, college campuses, business parks and many other locations.
Wind turbine construction is more complicated, and there are many more variables than with solar panels. There are 2 million farms in the US, 115,576 schools, 26,500 nursing homes, 14,000 business parks, 6,000 hospitals and 4,000 college campuses. Each of these would need a slightly different windmill configuration and the costs would vary accordingly. However, for the sake of simplicity, let’s say we want 2 million farms to have a 20kW system, roughly double the amount of rooftop solar needed for a single-family home.
Windmill installation is considerably more expensive than solar installation, and a 20kW system would come in at roughly $140,000. [1] Two million of those would therefore “cost” $280 billion. As with the solar panels, this would be a loan, repaid as the equivalent electricity bill and therefore, at the end of the cycle, costing the government nothing. The total outlay in the first 10 years would be $190 billion.
Schools, colleges, business parks, hospitals, residential care homes, etc. would need a larger system, or perhaps more than one turbine. Let’s say these would each need, on average, a 1MW system, coming in at $2.4 million each. And let’s say these are going to be installed at 200,000 locations across the country. That would come to a total bill of $480 billion. Total outlays would come to $304 billion over 10 years. And again, once the loans had been repaid, the total cost to the taxpayer would be zero dollars.
[1] See Lantz, E., et al. (2016). Assessing the Future of Distributed Wind: Opportunities for Behind-the-Meter Projects. In National Renewable Energy Laboratory (NREL/TP-6A20-67337). https://www.nrel.gov/docs/fy17osti/67337.pdf
Transmission and a “smart” grid
One of the biggest obstacles right now to a fully renewable electricity grid is the grid itself, which is out of date and very inefficient for moving electricity around the country to where it is needed, when it is needed. The existing grid is also designed for one-way transmission of electricity from a few central electricity power plants out to millions of homes and businesses. The new grid needs to be able to cope with two-way traffic from a large number of generating sources, including millions of rooftops, to meet the needs of those same homes and businesses. It also needs to cope with a large number of localized battery storage locations to manage the peaks and troughs of electricity needs.
The Electric Power Research Institute estimates that building a new national “smart grid” for the US would cost $388-$476 billion, but the benefit would be $1-$2 trillion in efficiency savings over the long term, plus a reduced carbon footprint.[1]
Recently, with the 2021 Bipartisan Infrastructure Bill (BIL) and the 2022 Inflation Reduction Act (IRA), over $17 billion has been invested in US grid technology, including $3 billion specifically targeted toward smart grid technology.[2] But at best, the grid will need at least $371 billion more.
[1] EPRI. (2011, March 29). Estimating the Costs and Benefits of the Smart Grid. Electric Power Research Institute. https://www.epri.com/research/products/1022519
[2] The Bipartisan Infrastructure Law of 2021 includes $3 billion in grants particularly directed to the smart grid (Section 40107), including increasing capacity, safety, integrating smart technology at both transmission and distribution levels, and improving integration of vehicles and buildings. Further, $5 billion goes toward grid resilience at large (Section 40101), $5 billion for an energy infrastructure financial assistance program not specific to smart grid technology (Section 40103b), $1 billion for energy improvement in remote and rural areas, $10 million for transmission facilitation (Section 40106), $500 million for state energy conservation and transmission siting plans (Section 40109). The Inflation Reduction Act dedicates $2.86 billion to grid technology (Sections 50151-50153), though these are not specific to smart grid technology.
Battery storage
It would be great if the sun shone and the wind blew in rhythms matching consumer energy needs. But they don’t, so efficient energy storage is crucial. Batteries are already much more affordable, but we’ll need both economies of scale and further innovation to bring the prices down still more. And that means more investment.[1]
Once again, though, if our goal is to get batteries into homes and institutions, we’re looking at a different picture. Neither transmission nor storage are investments repaid by generating electricity. They are investments in the stability and reliability of the grid for all users. It is a taxpayer and/or homeowner expense.
Once again, battery costs vary across the country, and in general they’re getting more affordable, although this could change with developments in battery technologies and the materials used. An average “3-day” battery for a medium-sized household currently costs an average of $10,000. These are already heavily subsidized in some states.[2]
If our goal, as above, is to make it possible for the less wealthy families to afford battery storage and leave the wealthier families to buy their own, then we are looking at costs per household on a sliding scale that averages out at $10,000 per household for roughly half of all households. That would come to a total of $650 billion to subsidize the cost of batteries for up to half of all households.
[1] See Solar Battery Costs: Everything You Need to Know About Batteries for Home Solar Prices [2023 Data]. (2023, January 18). Angi. https://www.angi.com/articles/solar-battery-cost.htm
[2] In Massachusetts, a combination of federal tax credit, a solar rebate “adder” for batteries and a “ConnectedSolutions” program where the utility company pays the customer for use of their battery storage means that installing a home battery works out to be almost free over a 10 year period or more. See https://www.energysage.com/local-data/storage-rebates-incentives/ma/
[1] Jacobson calculates these figures from the Levelized Cost of Electricity (LCOE) and assumes an overall reduction of electricity consumption by a similar percentage because of improved efficiency and reduced need for energy in extracting and processing fossil fuels. See Jacobson, M. Z., Von Krauland, A., Coughlin, S. J., Dukas, E., Nelson, A. J. H., Palmer, F. C., & Rasmussen, K. R. (2022). Low-cost solutions to global warming, air pollution, and energy insecurity for 145 countries. Energy and Environmental Science, 15(8), 3343–3359. https://doi.org/10.1039/d2ee00722c
[2] See Jacobson, M. Z., Von Krauland, A., Coughlin, S. J., Dukas, E., Nelson, A. J. H., Palmer, F. C., & Rasmussen, K. R. (2022). Low-cost solutions to global warming, air pollution, and energy insecurity for 145 countries. Energy and Environmental Science, 15(8), 3350. https://doi.org/10.1039/d2ee00722c
[3] Throughout a number of studies, Dr. Robert Pollin has worked toward developing frameworks for both specific national and broad global “Green New Deals.” In Pollin (2020), costs were determined based on the two categories of energy efficiency (including buildings, transportation, industrial equipment, grid and battery storage) and clean renewable energy (wind, solar, geothermal, small-scale hydropower and low-emissions bioenergy). Pollin, R. (2020). An Industrial Policy Framework to Advance a Global Green New Deal. The Oxford Handbook of Industrial Policy, 395. https://doi.org/10.1093/oxfordhb/9780198862420.013.16
[4] Pollin used EIA estimates of levelized costs of new generation resources to find that the amount of additional renewable energy needed between 2020 and 2050 (around 142,432 TWh) would cost $24.1 trillion for energy efficiency investments and $97.2 trillion for clean renewable energy. This comes to $121.3 trillion total, or approximately $4.5 trillion per year from 2021 to 2050. Pollin, R. (2020). An Industrial Policy Framework to Advance a Global Green New Deal. The Oxford Handbook of Industrial Policy, 413. https://doi.org/10.1093/oxfordhb/9780198862420.013.16
Transportation
Table: Capital investment needed in transportation
Public transportation
A green transition will also require a massive investment in (electrified) public transportation for inner cities and poorer rural communities. The American Public Transportation Association calculates an investment of $232 billion to bring the nation’s public transit up to date.[1]
Funding from the Infrastructure Act of 2021 has included grants for public transportation infrastructure in inner cities and rural areas across the US. However, so far it has provided only 5-10% of the total amounts being requested. In Fiscal Year 2023, the program provided grants totalling $2.275 billion, just 1% of the total investment needed for upgrading and greening the US public transportation system.[2]
[1]This is not all for carbon-free transit, but is a guide to what is needed. See APTA. (2019). Public Transportation Infrastructure: Critically Needed Investments. APTA. https://www.apta.com/wp-content/uploads/APTA_Policy-Brief_Infrastructure_March_2019-Final-004.pdf
[2] APTA Policy Brief, Restoring RAISE grant investments in public transportation, Sept 13, 2023: https://www.apta.com/wp-content/uploads/APTA-BRIEF-RAISE-Grant-Program-09-13-2023.pdf
High-speed rail
Building a national high-speed rail (HSR) network is another important priority if our goal is to reduce the number of cars on the road and also the number of planes in the sky. Again, costs are difficult to determine because prices vary: Japan’s pioneering bullet train cost about $5 million per mile in the 1960s, Europe’s early ventures into HSR cost about $10 million per mile in the 1970s, and China’s most recent rail expansion has been costing closer to $50 million per mile.[1]
To lay 17,000 miles of HSR track in the US was estimated to cost between $425-$680 billion in 2019.[2] That might take until 2050 to complete, so roughly a third ($226 billion) would be needed up to 2030. The U.S. company Brightline West plans to build a 218-mile track from Las Vegas to Southern California, with a budget of $12 billion by 2028, coming out to around $55 million per mile.[3]
[1] See Feigenbaum, Baruch (2013), High-Speed Rail in Europe and Asia: Lessons for the United States, Reason Foundation. p15. https://reason.org/wp-content/uploads/2013/05/high_speed_rail_lessons.pdf
[2] According to figures from US High Speed Rail Association that are no longer posted. https://www.ushsr.com/hsrmap/ Other estimates suggest it would come to over $1 trillion. See O’Toole, Randal (2021), The High-Speed Rail Money Sink, CATO Institute: https://www.cato.org/policy-analysis/high-speed-money-sink-why-united-states-should-not-spend-trillions-obsolete
[3] Shepardson, D. (2023, August 9). US railroad Amtrak exploring high-speed rail service in Texas. Reuters. https://www.reuters.com/world/us/us-railroad-amtrak-exploring-high-speed-rail-service-texas-2023-08-09/
Electric Vehicles (EVs)
As described in chapter 4, the Inflation Reduction Act has included incentives for purchasing an EV that are confusing at best. At worst, they are actually a disincentive to buying EVs, which remain significantly higher priced than equivalent gas or diesel-powered cars.
Table: Comparison of 2022 EV prices with equivalent gasoline cars[1]

Of the models[2] listed above, only the Ford F150 EV qualifies for the full $7,500 IRS[3] tax credit following new battery-sourcing and US-made requirements in place since April 2023. (Again, if the goal is to reduce carbon emissions, boycotting China for political reasons can most generously be described as counterproductive.)
Only one car choice, but it gets worse. The Ford F150 EV costs $10,334 more than its gas-powered equivalent. Even with the $7500 “incentive,” it still costs $2,834 more to buy the electric version.
That doesn’t help car-buyers much, and it doesn’t help low-budget buyers at all. The cheapest new car in 2022 was the gas-powered Chevrolet Spark, priced at $14,595. The cheapest EV on the market in 2022 was the Chevrolet Bolt—at $27,495, roughly double. Even with the IRS $7500 tax credit, it would still cost had been available then $5,500 more for the cheapest EV.
To overcome that disparity: double the IRS tax credit to $15,000, and apply it to all models of EV, not just the very few that currently qualify.
That would very likely attract many more takers than the IRA currently budgets for. If the IRA increased its $12.5 billion by a factor of 10 to roughly $125 billion, that would encourage every new car owner in the US to buy an EV instead of a gas-powered car. The US car industry would transform to accommodate that demand. As prices come down for EVs generally, the IRA budget for these tax credits could be tapered off, reaching 0 by 2030 and coming to a total of $440 billion over a 10-year period.[4]
[1] MSRP is Manufacturer’s Suggested Retail Price. Figures from Kelley Blue Book. https://www.kbb.com
[2] Brandt, E. (2022c, May 4). 2022 MINI Hardtop 2-door Review; 2022 Ford F150 Regular Can Review; 2022 Volvo XC40 Recharge Review, etc. Kelley Blue Book. https://www.kbb.com
[3] Note: IRS refers to the Internal Revenue Service, which gives the tax credit, not to be confused with the IRA, the Inflation Reduction Act, which authorizes it.
[4] $125 billion would cover a $15,000 credit for up to 8 million people, putting the price of an EV within range for roughly half of the 17 million people purchasing a new car in that year in the US (say, 2024). This in turn would spur mass manufacturing of EVs and bring down the prices still further. It would need to be coupled with regulations that set out a clear end-game for gasoline and diesel vehicles. Cutting that back each year by $2,500 would mean the credit was back to $7,500 by 2027 and down to zero by 2030.
EV charging infrastructure
The Bipartisan Infrastructure Law (BIL) included $2.5 billion for building out the EV charging infrastructure across the US, and construction is well underway. This will make it easier to choose to drive EVs, especially long distances.
This initial funding is just the tip of the iceberg, however. If the entire US is to move from gas and diesel vehicles to EVs, then all 145,000 gas/service stations in the country need to become EV charging stations (combined with rest stops/snack bars for people waiting for their batteries to be charged). And each of these charging stations needs a stand-alone solar array and/or wind turbine to generate the electricity, plus a utility-scale battery to store it.
A 1MWh battery system that can charge up to 20 EVs (before the system itself needs to be recharged) is currently advertised at $1.1 million,[1] but utility-scale battery costs are rapidly coming down and are expected to be less than half that price, at an average of $482,000 for a 1MWh battery in the near future.[2]
A 1MW wind turbine, meanwhile, costs another $1.3 million installed, so that adds up to $2.4 million additional investment for each EV charging station at current prices. If these were to be installed at just half of the 145,000 existing gas stations, that would come to $174 billion. Here we are talking about providing commercial loans for this equipment, since EV charging stations will be charging for the electricity provided and can easily make a business case for how much they can expect to sell in relation to the size of loan needed.
[1] Quick Deployment Mobile EV Charging Station With 1MWh Battery Backup. (n.d.). Battery Backup Power, Inc. https://www.backupbatterypower.com/products/quick-deployment-mobile-ev-charging-station-with-1mwh-battery-backup
[2] See NREL, Cost Projections for Utility Scale Battery Storage, 2023: https://www.nrel.gov/docs/fy23osti/85332.pdf
Heating homes and water
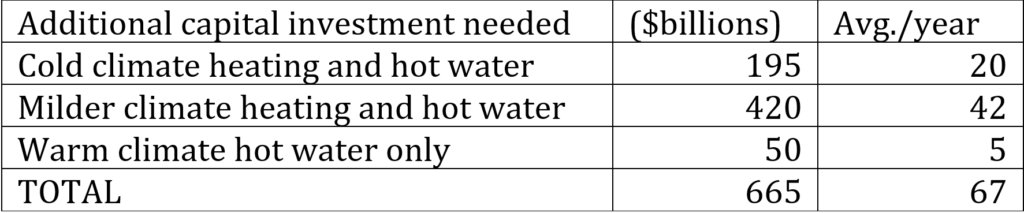
Table: Capital investment needed for US heating and hot water
It will be expensive to retrofit existing homes and commercial buildings to meet emission-reduction goals, but it will also create millions of jobs and reap huge savings in energy costs. A report from the Rockefeller Foundation suggested that an investment of $279 billion over 10 years could make a substantial difference, saving as much as $1 trillion in energy costs during the same period.[1]
District heating is an important option to consider, especially in countries and regions where geothermal and/or concentrated solar energy is readily available for community distribution. In continental US, most heating, cooking and hot water currently generated from fossil fuels will need to come from various forms of heat pumps, including mini-splits, which provide the most efficient form of heating for residential and commercial purposes.
As with rooftop solar, the idea would be to subsidize the cost of heat pumps and hybrid water heaters[2] for lower income households while expecting higher income households to pay for their own installations. As with all the other technologies discussed above, costs for heat pumps and water heaters vary enormously, as do the requirements for different households and for different parts of the country.
According to Geodiode,[3] only 5% of the US population lives in the “tropical” climate zone, requiring no heating in winter. Another 10% of the US population lives in the “Mediterranean” climate zone, requiring very little heat in the winter. Most of the population (around 65%) live in the “humid sub-tropical” climate zone, with cool winters but not extreme cold. Only about 20% of the population (63 million people) lives in a “continental” climate zone where winter temperatures reach, and often stay, well below freezing. It is the people in the last category – approximately 26 million households, mostly in the Northeast and Midwest US, who are most in need of air-sourced heat pump systems and in some cases, supplemental electric space heating.[4]
It’s not easy to find a breakdown of households by income and by climate zone. It seems possible that more higher income households live in colder climate zones of the Northeast and Midwest than in warmer ones. But for our purposes, we will assume income is roughly equivalent across climate zones. That would mean prioritizing 20% of 65.6 million lower income households, or roughly 13 million homes, for heating and hot water subsidies.
A family home mini-split installation for colder climates can cost up to $10,000, and a hybrid water heater can cost up to $5,000, so if the government were to provide subsidies up to $15,000 for 13 million households, that would come to $195 billion.[5] Subsidizing a further 42 million households living in the more temperate climate zones at $5,000 for water heating plus a smaller mini-split installation at $5,000 would come to $420 billion. Subsidizing the remaining 10 million households in zones that don’t need heating at all, for just for hot water, at $5,000 each, would come to $50 billion.
[1] See page 13: The Rockefeller Foundation & DB Climate Change Advisors. (2012). United States Building Energy Efficiency Retrofit. In Rockefeller Foundation. https://www.rockefellerfoundation.org/wp-content/uploads/United-States-Building-Energy-Efficiency-Retrofits.pdf This is 11 years out of date but we have not found a subsequent report.
[2] Hybrid water heaters use heat pump technology to heat the water from the ambient air in a basement or closet, supplemented with electric coils to top up the heat when necessary.
[3] Population and Climate Type. (2019). https://geodiode.com/climate/population
[4] Energy Star is a US Government program that certifies energy efficient products, a requirement for IRA tax credits. Energy Star Cold Climate Certified heat pumps must have at least 70% of their 45°F heating capacity at temperatures of 5°F, meaning that it takes around 1.4x the amount of energy to get the same heat increase at 5°F as it does at 45°F. The Department of Energy began incentivizing companies in 2021 to develop heat pumps optimized for 5°F and -15°F operation. Multiple companies have taken on this “challenge” to achieve commercial viability of such heat pumps by the end of 2024. Energy Star. (2022). ENERGY STAR® Program Requirements Product Specification for Central Air Conditioner and Heat Pump Equipment: Eligibility Criteria Version 6.1. In Energy Star (p.5). https://www.energystar.gov/sites/default/files/asset/document/ENERGY%20STAR%20Version%206.1%20Central%20Air%20Conditioner%20and%20Heat%20Pump%20Final%20Specification%20%28Rev.%20January%20%202022%29.pdf
[5] With 65.6 million households earning below the median income in the US, and roughly 20% of them in the colder climate zones, that comes to 13 million homes potentially needing assistance to install heat pumps and hybrid water heaters. If the average subsidy for those two items is $15,000, 13 million families getting $15,000 each comes to $195 billion.
Afforestation
On top of subsidizing a comprehensive transition from fossil fuels to clean, renewable energy, a major tree-planting initiative is needed in every country to reforest de-forested areas and build up the earth’s natural capacity for carbon sequestration. As described in chapter 6, the priority for the next 10 years is to make drastic reductions in carbon emissions, especially in the three sectors above, namely, electricity generation, ground transportation and heating. Nevertheless, meeting the goal of net-zero emissions by 2050 will require a global campaign of tree-planting and environmental remediation. This needs to be started now, not in 2030, because trees take decades to reach maturity and full carbon-capture capacity.
To launch a tree-planting effort in the US similar in scale to the New Deal of the 1930s would involve hiring perhaps one million people to plant one billion trees over the next decade. At an average liveable wage of $30-$40,000 per year, that would cost roughly $30-$40 billion per year, or $300-$400 billion for 10 years.
[1] The New Climate Economy. (2018). Unlocking the Inclusive Growth Story of the 21st Century. The Global Commission on the Economy and Climate. https://newclimateeconomy.report/2018/wp-content/uploads/sites/6/2018/09/NCE_2018_ExecutiveSummary_FINAL.pdf
[2] NCEI. (2022). Billion-Dollar Weather and Climate Disasters. National Centers for Environmental Information; NOAA. https://www.ncei.noaa.gov/access/billions/
[3] Intergovernmental Panel on Climate Change (IPCC) (Ed.). (2022). Mitigation Pathways Compatible with 1.5°C in the Context of Sustainable Development. In Global Warming of 1.5°C: IPCC Special Report on Impacts of Global Warming of 1.5°C above Pre-industrial Levels in Context of Strengthening Response to Climate Change, Sustainable Development, and Efforts to Eradicate Poverty (pp. 93–174). Cambridge University Press. https://doi.org/10.1017/9781009157940.004
[4] Schwartz, I. (2018, August 9). Alexandria Ocasio-Cortez: Under Medicare For All, You Won’t Have To Worry About Funeral Expenses. Real Clear Politics. https://www.realclearpolitics.com/video/2018/08/09/alexandria_ocasio-cortez_under_medicare_for_all_you_wont_have_to_worry_about_funeral_expenses.html
[5] U.S. Treasury. (2023). Understanding the National Debt. U.S. Treasury Fiscal Data. https://fiscaldata.treasury.gov/americas-finance-guide/national-debt/
[6] See table 4-1 Levelized Cost of Electricity.
[7] EIA. (2022). Levelized Cost and Levelized Avoided Cost of New Generation Resources in the Annual Energy Outlook 2022. U.S. Energy Information Administration. https://www.eia.gov/outlooks/aeo/pdf/electricity_generation.pdf
[8] In 2020, the percentages globally were 31% public and 69% private. See IRENA and CPI. (2023). Global landscape of renewable energy finance. International Renewable Energy Agency. (p. 73). https://mc-cd8320d4-36a1-40ac-83cc-3389-cdn-endpoint.azureedge.net/-/media/Files/IRENA/Agency/Publication/2023/Feb/IRENA_CPI_Global_RE_finance_2023.pdf?rev=8668440314f34e588647d3994d94a785
[9] Chomsky, Noam and Pollin, Robert, Climate Crisis and the Global Green New Deal, Verso, 2020, p.156-157.
[10] See IRENA & CPI. (2018). Global Landscape of Renewable Energy Finance. In International Renewable Energy Agency. International Renewable Energy Agency. https://www.irena.org/publications/2018/Jan/Global-Landscape-of-Renewable-Energy-Finance and Goldman Sachs, “The US is Poised for an Energy Revolution,” (2023, April 17). https://www.goldmansachs.com/intelligence/pages/the-us-is-poised-for-an-energy-revolution.html
[11] US Census Bureau, 2022, Table A-2. Households by Total Money Income, Race and Hispanic Origin. https://www.census.gov/library/publications/2022/demo/p60-276.html